DETAILS
Used dataset:
Date:
Category:
MAKE HISTORICAL MAPS YOURSELF ON THE LOKSTAT WEBSITE
Of all the industrial censuses that have ever taken place in Belgium, the one of 1896 occupies a special place. It was the first census that gave a fairly reliable overview of the various industries in all the localities of the country. If you are looking for solid information about local industries, cottage industries in rural areas, old occupations that no longer exist or searching for data on the economic development of Belgium, you will find just what you need in this source.
The census results can be consulted per municipality as well as per industrial sector. Moreover, the tables can also be visualised spatially using a map program developed by the Department of Geography of Ghent University. Thanks to this application, the reader can make numerous maps of the distribution and employment in the following industries:
- mining
- quarrying
- metal industry,
- ceramic industry
- glass industry
- chemical industry
- food industry
- textile industry
- clothing industry
- construction industry
- wood and furniture industry
- leather and skin industry
- tobacco industry
- paper industry
- book industry
- arts and precision industry
- transport
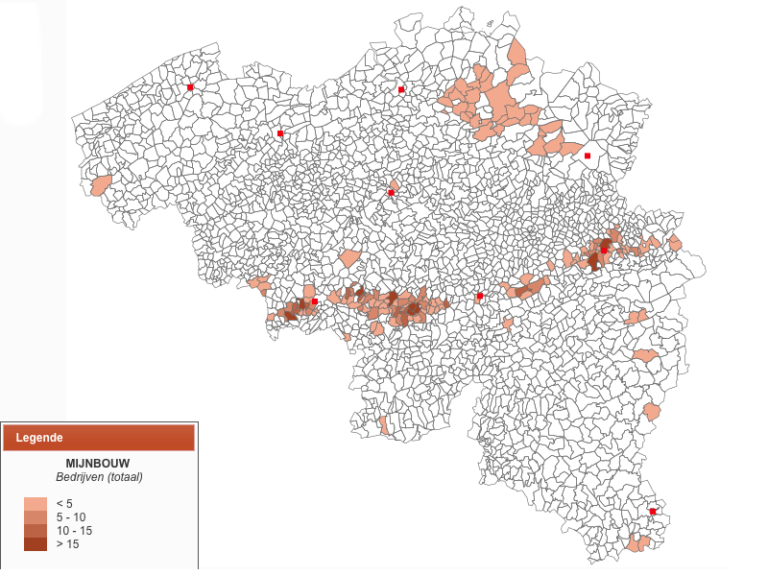
The image below shows the distribution of mining companies across the whole of Belgium. What is remarkable are the many small open-cast firms that mined iron in the Campine area around 1900. Moreover, numerous more specific applications are also possible.
Curious about where in the country roof tiles were made or cameras were produced? Would you like to know how many people were employed in the diamond industry or how many men and women were engaged in decorative ceramics? Dive into the application yourself and search for the data that are useful for your research!
Contact the Quetelet Center to start working with other data series from the LOKSTAT database!