Wind and water power in 1774

DETAILS

Used database:

STREAM

Date:

September 2021

Category:

Scientific publication

WIND AND WATER POWER IN 1774

Before the advent of steam engines, mills were the most ingenious machines in common use. The oldest existing mill in the Low Countries dates from 1183 and was built in Wormhout. Important applications of mills were grinding grain, pumping water and sawing wood.

The Quetelet Center made a detailed survey map of the mill distribution based on the Ferraris map around 1774 (database STREAM) . This map was published in an article by Alain Goublomme (chairman of Molenforum Vlaanderen and Oost-Vlaamse Molens vzw) and Wouter Ronsijn (researcher of the Bocconi University in Milan and UGent) on the occasion of the expo Naar molens kijken (looking at mills) at the heritage site Ename. The red dots are windmills concentrated in the northwest and north. The blue dots represent water mills which were mainly to be found in areas with differences in altitude.

Article:

Alain Goublomme, Wouter Ronsijn. “Kijken naar molenland”. G/oud: geschiedenis van Oudenaarde en Omgeving, 1, (2021):  32-39.

Ostend measured and counted

DETAILS

Used database:

POPPKAD

Date:

October 2021

Category:

Scientific publication

OSTEND MEASURED AND COUNTED

Ostend was an important port that developed into a bustling city and tourist centre in the course of the nineteenth century. A large part of this past is still shrouded in darkness by the disastrous destruction of important archival collections during and after the Second World War. Authors Pieter François (University of Oxford, Centre for Study of Social Cohesion) and Luc François (Professor Emeritus of History UGent) partly fill this gap with a remarkable and rare study of the Ostend land register on the eve of the Belgian revolution. They describe in detail the spatial organisation, the housing, the port buildings, the landowners, the tenants and the distribution of wealth on the basis of the real estate data collected by the cadastre in 1829-1834. The Quetelet Center processed the data at house level in overview maps.

Article:

Luc François en Pieter François. “Oostende gemeten en geteld: het kadaster van net vóór 1830”, in Als spaken van een tredmolen: gedenkwaardige en- of historische feiten, De Plate. Jubileumboek, 36(2021), 81-95.


The impact of Belgian transport policy

DETAILS

Used dataset:

LOKSTAT

Date:

August 2021

Category:

Scientific publication

THE IMPACT OF BELGIAN TRANSPORT POLICY

In the course of the nineteenth century, Belgium underwent a radical transformation in terms of mobility. In barely half a century, mobility increased enormously with the advent of the railways and the expansion of the transport network. The role that the transport policy played in this transition has not yet been sufficiently studied. Historian Ingrid Schepers (University of Antwerp) investigates the connecting function of the Belgian railways by means of relational geography and combined various forms of mobility. She shows how much the transport policy was decisive for labour mobility and the complex relationship between city and countryside. For her research, she used commuter data and census data from LOKSTAT.

Article:

Ingrid Schepers. “Vertrekken, blijven of beide? De invloed van het Belgische transportbeleid op de arbeidsmobiliteit van de plattelandsbevolking tijdens de negentiende eeuw?”, in Stadsgeschiedenis, 16(2021), 1, 3-20.

forgotten flu epidemics

DETAILS

Used database:

HISSTER

Date:

2 June 2020

Category:

Blog post

forgotten flu epidemics

Auteur: Patrick Deboosere, demographer at the VUB’s Interface Demography.

(Only available in Dutch)

De oversterfte door Covid-19 heeft van april 2020 de dodelijkste aprilmaand gemaakt sinds de Tweede Wereldoorlog. Zonder de drastische maatregelen die we intussen allemaal kennen zouden de cijfers zelfs nog flink stuk hoger opgelopen zijn.

Covid-19 is net als griep een virale aandoening. Een vergelijking is dus niet zo gek. De Spaanse griep van 1918-1919 geldt dan vaak als referentie. Aan die epidemie stierven in ons land naar schatting ongeveer 30.000 mensen. Vaak ook jonge mensen. Achteraf bleken sterftecijfers heel sterk te verschillen tussen steden waar quarantainemaatregelen werden genomen en plaatsen waar niets werd gedaan.

Maar niet enkel de Spaanse griep kostte veel mensenlevens. Bij vrijwel iedere griepepidemie kunnen we de verhoogde sterfte registreren. Ook in België is dit het geval.

In recente jaren is aldus gebleken dat verschillende griepepidemieën door ons land zijn getrokken en een spoor aan oversterfte hebben nagelaten. De meest recente golf van griepgebonden oversterfte in België werd opgetekend tussen eind februari en de eerste helft van maart 2018. Ook in januari 2017 was er een kortstondige episode van lichte oversterfte en wat verder terug in de tijd, in februari 2015, was er al een grote oversterfte vastgesteld.

Het is pas recent dat we in Europa binnen verschillende landen dagelijks de sterfte opvolgen en gebruiken om gezondheidscrisissen op te sporen en daar lessen uit te trekken. Een griepuitbraak in vroegere tijden werd dus pas wat later vastgesteld. In tegenstelling tot vandaag kon men de schaal ervan niet meteen opmeten en inschatten. Dat valt goed af te lezen uit de verslaggeving in kranten uit die tijd.

Historisch werden een aantal wereldwijde griepepidemieën als heel bedreigend ervaren en deze zijn dan ook in het collectieve geheugen gegrift. De meest bekende zijn de Aziatische griep van 1957-58 die naar schatting wereldwijd een miljoen mensen het leven zou hebben gekost, de Hong-Konggriep in 1968-69 en de Mexicaanse griep in 2009. Voor 1957-58 merken we in België inderdaad een langdurige periode van oversterfte die start in oktober 1957 en zal aanhouden tot april 1958. Er is geen sprake van een echte piek, maar van maandenlange hoge sterftecijfers. Ook de Hongkonggriep laat in januari-februari 1968 een piekmoment zien. De Mexicaanse griep van zijn kant lijkt in België weinig impact te hebben op de sterfte.

Maar er zijn ook de vergeten epidemieën. Zo hebben we in België twee wintermaanden meegemaakt waarbij de absolute sterftecijfers hoger waren dan de piek die covid-19 in april 2020 heeft veroorzaakt. Het gaat om januari 1951 met 15.399 overlijdens en februari 1960 met 15.425 overlijdens. Gegeven dat de Belgische bevolking kleiner was dan vandaag zijn de bruto sterftecijfers voor die twee maanden hoger dan deze van april 2020, omgerekend naar jaarbasis ongeveer 21 overlijdens op 1000 personen tegenover 16 in april 2020.

Op 13 januari 1951 wordt in de Belgische pers melding gemaakt van een “vreselijke griepepidemie in Noord-Engeland”, de zwaarste sinds de griepepidemie van 1918. De “doodgraversploegen moeten worden versterkt” en de economie lijdt onder de massale ziekte. De Gazet van Antwerpen van 16 januari 1951 schrijft dat de griepepidemie volgens de Wereldgezondheidsorganisatie oprukt in twee kolonnes. Er is een infectiehaard in Noord-Spanje en een andere in Zweden. Maar, “de tijdens de oorlog ontdekte sulfamieden en antibiotica” zullen het mogelijk maken “secondaire infecties die de meeste slachtoffers hebben gemaakt tijdens de epidemie van 1918, suksesvol te bestrijden.” De dag voordien had de Gazet van Antwerpen op haar voorpagina ook al over de griepepidemie bericht onder de titel “Belgen bieden hardnekkig weerstand” (GvA 15/1/1951). “Sommige buitenlandse bladen publiceren fantastische berichten over de griep-epidemie in België. Lazen wij niet dat ongeveer 1/3 der Belgische bevolking bedlegerig zou zijn!… God zij dank, zo’n vaart neemt het niet! Ofschoon wij nog niet in het bezit konden komen van officiële statistieken, blijkt het dat de ziekte thans stationnair is en in sommige streken zelfs terugloopt. De bevolking biedt prachtig weerstand. – weerstand die voornamelijk te danken is aan de goede voeding. Zo nochtans de sterfgevallen toenemen, dan is dit niets ongewoons, vermits het sterftecijfer elk jaar stijgt in de wintermaanden.”

Wanneer de Gazet van Antwerpen diezelfde maand (27/1/1951) nog over de griep bericht is het om te verwijzen naar Engeland waar de week voordien 1.099 personen aan de griep zijn gestorven en hoe overal ter wereld schepen uit Engeland in quarantaine werden geplaatst.

Terwijl de griep van 1951 wereldnieuws was omwille van het dodelijk karakter, lijkt het dat de griep in 1960 eerder als ongevaarlijk werd gezien. De Gazet van Antwerpen zal in februari 1960 in meer dan 100 artikels naar de griep verwijzen. Maar de toon is geruststellend. Op 9 februari 1960 titelt de krant op de voorpagina “Veel zieken, maar geen griepepidemie in ons land”. En het artikel stelt “Men mag niet van een griepepidemie in België spreken. Al heerst de ziekte vrijwel overal, zo is het aantal aangetaste personen toch zeer veranderlijk volgens de streken en nergens boezemt zij levendige ongerustheid in. Voorts worden vooral volwassenen door de griep getroffen. Geen enkele school schijnt haar deuren te hebben moeten sluiten, ofschoon de griep van 1960 een kenmerkend sterk besmettelijk karakter heeft, dat haar enigszins op hetzelfde niveau als de epidemische ziekten plaatst. (…) Uit de verklaringen van de zieken en van de overwerkte geneesheren die de duizenden zieken verzorgd hebben, mag men besluiten dat de griepverschijnselen – een griep die dit jaar typisch Belgisch lijkt te zijn, daar zij naar verluidt minder erg is dan de griep die in de overige Europese landen heerst – de volgende zijn: hoofdpijn, rillingen, koorts en algemene vermoeienis. Met sulfamiden en vitaminen C is men de griep spoedig de baas.”

De volgende dagen zal de krant ook vol staan met reclameboodschappen over de griep. “Het staat thans vast, dat de griep 1960 in werkelijkheid niet gevaarlijk is. Ze wijkt voor een doorgedreven behandeling met “ASPRO”, 2 tabletten om de 3 uur, en warme dranken.” (20 februari 1960) De werkelijkheid was echter grimmiger, alleen waren de tijdsgenoten zich er niet van bewust.


Sources:

  • Data: UGent Quetelet Center, Hisster database.
  • Quotations: Gazet van Antwerpen, Digital archive.

From plague to Coronavirus

From plague to Coronavirus. A very brief history of epidemics in Flanders and Belgium.

DETAILS

Used datasets:

HISSTER & STREAM

Date:

25 May 2020

Category:

Publication & video

Author: Isabelle Devos

The coronavirus has dominated our daily lives for several months now. It seems as if COVID-19 is the most widespread infectious disease on earth. Statements such as ‘nothing will be the same again’ or ‘there will be a pre- and a post-Corona era’ intimate the worst possible scenarios.

Counting nearly 300,000 deaths (as of 15th May 2020) the coronavirus is, however, not (yet) nearly as deadly as many other infectious diseases. Tuberculosis, AIDS and malaria, the three so-called ‘big killers’, claim millions of lives every year, mostly in the southern hemisphere. Even the plague itself, yes the plague, is still responsible for thousands of infections a year. In fact, the island of Madagascar suffered a serious plague epidemic as recently as 2017. 

In Europe and North America, however, we have not only forgotten how to handle epidemics, many of us have also forgotten that up to 100 years ago infectious diseases were the most common cause of death. It is therefore high time to refresh our memory.


Epidemiological transition (nineteenth to twentieth centuries)

General public health has considerably improved in the northern hemisphere since the early nineteenth century. Life expectancy has more than doubled in the last 200 years. In Belgium, it rose from around 37 years in 1830 to 47 years in 1900, 65 years in 1950 and 81.5 years today. However, progress has been far from equally distributed. It was greater for children than for parents and also for women than for men. The decline in death rates went hand-in-hand with a radical shift in causes-of-death. Infectious diseases such as smallpox, cholera and tuberculosis gradually changed places with degenerative diseases such as cardiovascular diseases and cancer. In technical parlance, this is referred to as ‘the epidemiological transition’. Of the circa 110,000 Belgians who die every year today, more than half are the result of cardiovascular diseases (28%) or cancer (26%).

Research attributes three main causes to the mortality decline of infectious diseases. While in the first phase improvement in hygiene and sanitary conditions played the primary role, during the nineteenth century increasing living standards were responsible (such as more and better nutrition). Only since 1945 has medicine (antibiotics and vaccines, chemotherapy, surgery etc) played a greater role. That is hardly surprising seeing that it is only since the late nineteenth century that we have been aware that bacteria, viruses and parasites cause diseases (the so-called ‘bacteriological revolution’). 

Besides a shift from low to higher life expectancy and from infectious to chronic diseases, death rates today also reveal a more stable pattern, even though at this moment in time COVID-19 gives precisely the opposite impression. The yearly crude mortality rate (the number of deaths per thousand inhabitants), a number subject to strong fluctuations in the past, in Belgium decreased from between 30 and 45 deaths in the early nineteenth century to a constant of around 10 deaths in the late twentieth century. Although tuberculosis was the main cause of death during the nineteenth century , epidemics were caused by other diseases. Belgium was ravaged by cholera seven times in 1832-33, 1848-49, 1854, 1859, 1866, 1883-85 and 1891-95. With around 43,400 victims, the epidemic of 1866 was the most severe; it hit young active people the hardest. Typhoid, smallpox and influenza also caused mortality crises in 1846-47, 1871 and 1918-19 respectively.


Such epidemics could display enormous regional variations. Hotspots of infection, as is the case today with COVID-19 in e.g. Limburg and Lombardy in Italy, are generally related to the place of the outbreak and the way in which the disease is transmitted, via people (tuberculosis, smallpox, COVID-19), via insects (malaria, the plague) or via water and food (cholera, typhoid, dysentery). In addition to population density and mobility, the social, economic and political context can also play an important role. As such, the typhoid epidemic of 1846-47 hit West- and East Flanders the hardest, regions which were both strongly affected by the crisis in the linen industry and in agriculture, while the cholera epidemic of 1866 mainly affected the larger cities, and the Spanish flu in 1918-19 was initially most deadly near the war front. The Spanish flu was also the last pandemic which Belgium was confronted by. Contemporaries estimated the death toll from the disease in Belgium to be around 20,000, however, based on data from the pandemic in neighbouring countries we can assume that the true number was at least double that. 

Historical sources of excess mortality

The further one goes back in time the more difficult it is to identify the specific disease causing the outbreak of an epidemic. It was only after the cholera epidemic of the late 1840s that the specific cause of death was recorded for each case. Before this period, one has to interpret general descriptions given in medical accounts, chronicles and municipal records. 

Furthermore, the calculation of the number of deaths and the spread of an epidemic also becomes more complex. The introduction of the civil register at the end of the eighteenth century meant every death was now recorded locally, however, this was not the case in previous centuries where one can only consult parish registers for notifications of burials and baptisms.  

Just as there is a great deal of discussion today about the way in which excess mortality due to COVID-19 is recorded and calculated, much ink has also been spilt in historical research regarding the best indicator of excess mortality. Some authors will compare the number of deaths in the year of an epidemic with the average number of previous years. Others will consider the total number of the population and base their calculation on the crude mortality rate per thousand inhabitants. 

In the absence of reliable population censuses in the Early Modern period (sixteenth to eighteenth centuries), such an indicator is not an option for the Southern Netherlands. An alternative is to calculate the ratio of the number of burials in relation to baptisms, a method that has already been used for Early Modern England. Depending on the indicator, the peaks in the graph can vary but at least the various methods usually do indicate excess mortality as occurring during the same years. 

Burial register 1640-1641, parish of Kruishoutem.

The Early Modern period (sixteenth to eighteenth centuries)

Using the large-scale STREAM database (UGent, Quetelet Center) we can map excess mortality in the Duchy of Brabant and the County of Flanders between 1640 and 1795. This comprises the yearly data of 507 parishes (out of a prior total of 1125). Ratios above 100 point to a greater number of burials than baptisms and a negative natural growth; ratios below 100 indicate a positive growth. Four peaks in the graph stand out: those at the end of both 1660 and 1670, and those in the middle of the years 1690 and 1790. During the eighteenth century, there were fewer peaks of excess mortality and, furthermore, these peaks were not as large. 


During the eighteenth century, central government intervened to a greater extent at the level of public health and also started to take more preventative action. Before then public hygiene was left to local authorities. Each city and village approached this in their own particular way. Isolation and quarantine of (potentially) ill patients were the most commonly used measures. 

In the Southern Netherlands, it was the battle against dysentery epidemics that constituted the hesitant beginnings of state intervention in such matters. As such, burying of the dead in churches and chapels was prohibited to counter stench and possible danger. Henceforth cities had to plan new burial grounds far away from church buildings and outside city walls. 

From the middle of the nineteenth century on, sanitary measures were planned in conjunction with medical societies in a more structured way and with greater financial means. Infectious diseases were gradually pushed back when central and local governments, themselves or through private contractors, installed systems of piped-water supply and sewerage, while also, goaded by labour organisations, improving housing and working conditions.


Gilles Le Muisis
Tournai Citizens burying Victims of the Black Death, Chronicle by Gilles Li Muisis (1272-1352).

In the framework of the STREAM project, a historical-geographical information system was developed based on the map of Count de Ferraris (1771-1777) allowing us to visualise the yearly evolution of mortality ratios. 

Principles for the registering of burials were laid down by the Catholic Church in 1614 but it was not before the 1640s that most priests in Flanders and Brabant began to systematically record burials. That is why the number of parishes in the STREAM data set increases overtime. 

The maps demonstrate that uncertainty was a fact of life in those days: the risk of death could differ enormously between regions and years. 


Video not playing? Watch it on our YouTube-channel!

Causes of excess mortality

Years showing excess mortality are often associated with famine but that in reality seems to have been the exception rather than the rule during the Early Modern period, as in the famine year of 1709. Famine is usually caused by very high grain prices, the result of a failed harvest after a wet summer or cold winter or following obstructions in the imports of grain. 

Military activities could also cause destruction or the plundering of harvests. Research has shown, however, that there is no strong link between living standards, as measured by grain prices, and mortality. Years of high prices do not necessarily go hand-in-hand with higher mortality rates and vice versa. There is a simple reason for this. We know from medical research that nutrition does not play a crucial role in the development of many infectious diseases. 

The same holds for most of the diseases that determined the mortality pattern in the Early Modern period, such as the plague, typhus, malaria and smallpox. These diseases are so virulent that the nutritional status of a person makes no difference. They do not differentiate between well-fed and malnourished people. The opposite is true for diseases such as dysentery, tuberculosis and cholera; the latter two, in particular, resulting in many victims during the nineteenth century. Unsurprisingly social differences in terms of health were much more outspoken in those days. In the Early Modern period, too, there was social inequality in death but it was conditioned by other factors such as housing and mobility. 

The Triumph of Death by Pieter Brueghel the Elder (ca. 1525-1569).
Battle of Steenkerque during the Nine Years' War, 1692.

Several mortality peaks, especially in the Early Modern period, show a link with wartime, albeit not uniformly. For example, the War of Spanish Succession (1701-13), considered one of the most important, together with the Nine Years’ War (1688-97), as regards duration, army size, and constantly shifting military fronts did not translate into excess mortality. 

Naturally, mortality was not only confined to soldiers in wartime but could have serious consequences for civilians too. Armies plundered, destroyed villages and spread diseases and epidemics. A telling example is the passage of the plague in 1667-68 during the War of Devolution. The mortality crisis in 1676-79 has in turn been linked to the spread of dysentery by the troops of Louis the XIV during the Franco-Dutch War (1672-78).

The most serious mortality crises occurred when war, high prices and epidemics coincided. That was the case in 1690 when death rates reached catastrophic proportions in western Europe as a result of the outbreak of epidemic diseases such as typhus and dysentery following a failed harvest and the destructive passage of French troops in the Nine Years’ War. 

Lastly, the wars of the French Revolution of the end of the eighteenth century were also responsible for a higher death rate: in addition to the greater number of murders and executions, a dysentery epidemic was responsible for the peak of 1794. 

There were also manifest differences between the Duchy of Brabant and the County of Flanders. A crisis could hit one region harder than another or indeed remain entirely untouched by one. As such, at the end of the Eighty Years’ War (1568-48) it was Flanders that was mainly affected. The people in the northwest were subjected to the particularly violent behaviour of the Dutch and Spanish armies. 

This was repeated ten years later, this time because of troops in the Franco-Spanish War (1635-59). In 1720 the region was in turn plagued by a serious epidemic of ‘intermittent fevers’, the contemporary term for malaria. This disease already caused higher mortality in the coastal and polder regions outside of peak years due to the many stagnant waters in the region: pools and marshes formed an ideal breeding ground for the type of mosquito that spread malaria, also called ‘marsh fever’ at the time. 

Elsewhere in Flanders during the 1720s, many fell victim to typhus, influenza or dysentery. The latter was also the cause of the excess mortality in Brabant in the 1740s and 1780s.

Sack of Wommelgem, 1589, Sebastiaan Vrancx.

From the medieval plague to COVID-19

The last time the Southern Netherlands were hit by the plague was during the epidemic of 1667-68. Up until that point the disease had descended on the population in successive waves and they were faced with an outbreak every decade or so. It is impossible to tell, however, whether high mortality rates were always caused by the bacteria Yersinia pestis since ‘plague’ was a word that covered a variety of infectious diseases. 

For the period preceding the keeping of parish registers, death notices in probate inventories, tax registers and annuities constitute the main sources for gauging the extent of mortality. The most severe outbreak of the plague known as the Black Death devastated the Southern Netherlands from the second half of 1349 onwards with flare-ups until 1351. Europe-wide mortality has been estimated at up to one third of the population. 

Some scholars believe that its impact in the Low Countries was not as great because of the better socio-economic conditions here, however, that favourable position has been strongly contested in recent studies.

During the eighteenth century, smallpox took over from the plague as the main cause of death, causing havoc among children in particular. Epidemics at the time tended to be the result of outbreaks of dysentery also called ‘the bloody flux’ because of the bloody diarrhoea accompanying the disease. 

A definitive explanation for the disappearance of the plague does not exist, although better rules for quarantine, stronger human immunity, decreasing virulence of the bacterium, or the disappearance of the black rat which spread the disease (probably) via fleas, have been cited as the main reasons. 

In contrast, there is no doubt about the reason for the decline in smallpox-related deaths. The discovery of a cowpox vaccine in the late eighteenth century by the English country doctor Jenner, the first vaccine ever, meant the disease could be brought under control in the majority of European countries including Belgium. As a consequence of the Franco-German War, a short but intense flare-up was recorded at the beginning of the 1870s. Today smallpox is the only disease that has been exterminated worldwide.

Heilige Rochus en de pestlijders, Pieter Paul Rubens, 1623-1626.
Saint Roch and the Plague Sufferers, 1623, Pieter Paul Rubens.
Image created by Laura Makaltses. Submitted for United Nations Global Call Out To Creatives - help stop the spread of COVID-19.
Artwork submitted for United Nations Global Call Out To Creatives - help stop the spread of COVID-19, Laura Makaltses.

Clearly, epidemics have always been with us. Many of our ancestors had to learn how to navigate and deal with outbreaks of disease. At first glance, it looks as if history is repeating itself with COVID-19. Many infectious diseases like the plague came from the East and spread via trade routes into Europe. 


As such, the link with globalisation is also easy to make in relation to former times. Yet the differences are great: mortality rates were much higher in the past, the majority of victims did not consist of vulnerable elderly people, and differences in healthcare and economic development were huge. 

It is characteristic of epidemics that they arise quickly, disappear quickly but unfortunately also reappear… Luckily medical advances are made at a much faster rate today meaning we will hopefully not have to wait too long for a vaccine against COVID-19. 

Let us make sure that it is also available to everyone!


If you want to use one of the datasets above, do not hesitate to contact queteletcenter@ugent.be


Or would you like to lend a hand to our new citizen science project www.sosantwerpen.be in which we, together with volunteers, will study the social inequalities in causes-of-death in the city of Antwerp (1820-1946)? 

Do you want to know who were the victims of epidemics in the past? Then register via sosantwerpen@ugent.be!


Sources

  • UGent, The Quetelet Center, Hisster database, 1804-2019.
  • UGent, The Quetelet Center, Stream database, 1640-1796.

Bibliography

  • Bruneel, Claude. La mortalité dans les campagnes. Le duché de Brabant aux XVIIe et XVIIIe siècles. Louvain, 1977.
  • Devos, Isabelle. Allemaal beestjes. Mortaliteit en morbiditeit in Vlaanderen, 18de-20ste eeuw. Gent, 2006.
  • Livi-Bacci, Massimo. Population and Nutrition. An Essay on European Demographic History. Cambridge, 1991.
  • Van Gelder, Klaas and Isabelle Devos. “War and Peace in the Time of Malthus. The Demographic Impact of Military Conflicts in Early Modern Flanders, 1650-1800”. Presentation prepared for the European Social Science History Conference, Leiden, March 2020.
  • Vermeersch, Joren. 1349. Hoe de Zwarte Dood Vlaanderen en Europa veranderde. Antwerpen, 2019.

The Spanish flu in Belgium: 20.000 or 282.165 deaths?

DETAILS

Used database:

HISSTER

Date:

April 2020

Category:

Blog post

The Spanish flu in Belgium: 20.000 or 282.165 deaths?

Author: Isabelle Devos

All kinds of figures are circulating about the death toll of the Spanish Flu. Depending on the author, some 10, 20, 50 or even 100 million people died worldwide during the epidemic in 1918-19. All these figures have two things in common, namely that they are very high and they are not usually based on a detailed study of the sources. In other words, they are rough estimates.

In an article published in De Standaard on 20 April 2020 (De ‘moeder aller pandemieën’ die onder de mat geveegd werd, which translates as The ‘mother of all pandemics’ that was swept under the carpet), Marc Reynebeau states that the epidemic of 1918-19 cost the lives of almost 300,000 Belgians. He bases this on the figure of 282,165 deaths mentioned in a master’s thesis (Antwerp University, 2017), where this figure is attributed to André Lambert, who studied the demography of the First World War. This figure is surprising, on the one hand because it is so precise and on the other because it is extremely high, even incredibly high. Research shows that nowhere does Lambert put forward a figure of 282,165 deaths for the Spanish Flu. Lambert only provides a table with the official annual mortality figures (regardless of the cause of death) between 1910 and 1920. This shows that 282,165 is simply the rounded sum of the total number of deaths in Belgium over two years (the sum for the years 1917-18, and moreover not for 1918-19). The figure of 282,165 deaths in the thesis is therefore based on the reasoning that every death in those years, from the youngest baby to the oldest Belgian, was due to the Spanish Flu. Which would mean that no one was killed then by any other disease or military force, or died outside the three brief waves of the epidemic. Of course, this is impossible.

Belgium is hardly ever mentioned in international studies on the Spanish Flu because the historical sources are incomplete and not transparent enough. In the Belgian context, however, the figure of 282,165 deaths from this thesis is already quoted on the Wikipedia page on the Spanish Flu, was used in a website that promotes flu vaccines, and recently it formed the basis of an article in the quality newspaper De Standaard. Such a figure, especially one of this magnitude, will therefore take on a life of its own. Numbers are attractive and easily copied, especially when they are available online. They radiate reliability but do not necessarily reflect reality. In particular, when it comes to epidemics from the past, it seems that the numbers can never be big enough. But the death toll does not have to be so high to have a major social impact, as we now know.

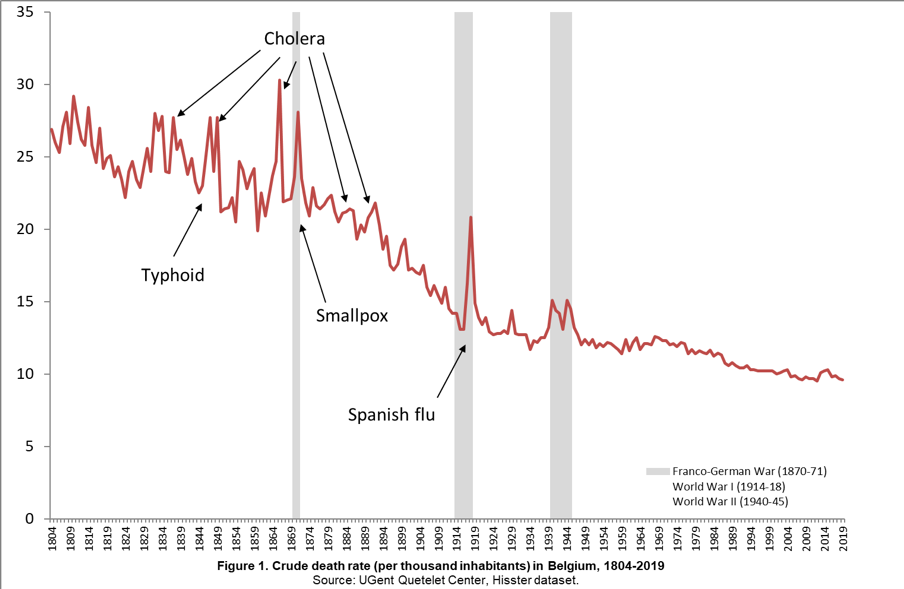
So far, not a single historian has ventured to calculate the number of victims of the Spanish Flu in Belgium. This is due to the fact that the cause of death statistics for the war years have not been preserved and it is therefore difficult to distinguish between deaths caused by war, flu or other diseases. Moreover, the mortality statistics for these years are incomplete: we do not have data for the worst affected municipalities on the war front, those in the Westhoek. Because the data at the national level are incomplete, in recent years there have been several studies on the Spanish Flu conducted at the local level (master’s theses UCLouvain, 2018 and Ghent University, 2005 and 2009). These show that the excess mortality could vary greatly from place to place, but that the mortality in 1918-19 was much higher than before the war almost everywhere. This is also indicated by quantitative analyses based on municipal data from the series of archives Le Mouvement de la Population et de l’Etat Civil (State Archives of Belgium). In comparison with the pre-war mortality figures (about 110,000 deaths annually), the figures in 1918-19 were on average a third higher.

Many European countries have more complete sources to measure the impact of the Spanish Flu. In recent decades, various studies based on historical sources and statistical methodologies have been able to determine more accurate mortality figures. For the Netherlands, these estimates range between 20,000 and 60,000 victims, for France between 230,000 and 360,000, and for England between 150,000 and 280,000. Depending on the scale of the epidemic, the Spanish Flu accounted for 10 to 25 per cent of the total annual mortality in the different countries. Taking into account a correction for under-registration, this means that in Belgium the epidemic claimed about 30,000 victims in the best case scenario and almost 80,000 in the worst case. Contemporaries estimated the mortality figure from the Spanish Flu in our country to be 20,000.

Over the past few months, reports on the corona epidemic have also alerted us to both the benefit and the dangers of numbers. There is a lot of discussion about the method of counting and calculating COVID-19 mortality. In Belgium, the scientific institute Sciensano has a comprehensive counting method: in addition to the COVID deaths in hospitals, it also reports people who died of the disease at home or in a residential care centre, along with any other suspected COVID deaths. Such detailed data help in better mapping the course of the disease, making better predictions and ultimately also avoiding deaths. Unfortunately, this does not make international comparisons any easier. Due to the comprehensive reporting method, the Belgian figures are much higher in relative terms than in other countries. In any event, the basis of our figures is clear. Something that cannot be said of the hallucinatory figure of almost 300,000 Belgian victims of the Spanish Flu.


Sources

  • State Archives of Belgium, Le Mouvement de la Population et de l’Etat Civil, 1910-1920. 
  • Ministère de l’Intérieur, Annuaire Statistique de la Belgique 1915-1919, Brussels. 
  • Quetelet Center, HISSTER Database, 1910-1920.


Bibliography

  • Ansart, Séverine, Camille Pelat, Pierre‐Yves Boelle, Fabrice Carrat, Antoine Flahault, and Alain‐Jacques Valleron. “Mortality burden of the 1918–1919 influenza pandemic in Europe”, Influenza and Other respiratory Viruses 3, no. 3 (2009): 99-106
  • Baudhuin, Fernand. Histoire économique de la Belgique, 1914-1939. Brussels: E. Bruylant, 1946, vol. 2.
  • Brulart, Benjamin. “La grippe espagnole en Belgique occupée (1918-1919) : analyse épidémiologique et étude de l’imaginaire et de la perception de l’épidémie à travers les carnets de guerre”. PhD. Diss., UCLouvain, 2018.
  • De Smet, Saartje. “De Spaanse griep in België”. PhD. Diss., Ghent University, 2005.
  • Hendrickx, Laurine. “Onderschat en onbeantwoord. De publieke perceptie van de Spaanse griep in de Belgische context (1918-1930)”. PhD. Diss., Antwerp University, 2017.
  • Johnson, Nial Philip Alan Sean, and Mueller Juergen. “Updating the accounts: global mortality of the 1918–1920 ‘Spanish’ influenza pandemic”. Bulletin of the History of Medicine 76, no. 1 (2002): 105–115.
  • Lambert, André, “La population de la Belgique dans la guerre 1914-1918”. Lecture for the memorial of WOI organized by de Vlaamse Vereniging voor Demografie and Société Démographique Francophone de Belgique, February 2014. http://adrass.net/WordPress/wp-content/uploads/2015/03/rap1418_final.pdf
  • Murray, Christopher J., Alan D. Lopez, Brian Chin, Dennis Feehan, and Kenneth H. Hill. “Estimation of potential global pandemic influenza mortality on the basis of vital registry data from the 1918–20 pandemic: a quantitative analysis”, Lancet 368, no. 9554 (2006): 2211-2218
  • Patterson, D.K., and Pyle G.F. “The geography and mortality of the 1918 influenza pandemic”. Bulletin of the History of Medicine 65, no. 1 (1991):4–21.
  • Reynebeau, Marc, “De ‘moeder aller pandemieën’ die onder de mat geveegd werd”. De Standaard, 20 April 2020. https://www.standaard.be/cnt/dmf20200419_04927397
  • Van Laere, Stefanie, “’Over-leven na de Groote Oorlog’. De demografische gevolgen van de Eerste Wereldoorlog in België in kaart gebracht”. PhD. Diss., Ghent University, 2009.

From farm to fork

DETAILS

Used database:

LOKSTAT & POPPKAD

Date:

December 2019

Category:

Scientific publication

From farm to fork

Food supply faced various challenges in the past centuries. Population growth, urbanization and industrialization put food supplies under pressure. To cope with the problems, scaling-up, innovation and technological improvements were necessary. The last issue of the CORN publication series is dedicated to the regulation of food production and distribution in the early modern and contemporary periods. Editors of this volume are Wouter Ronsijn (Ghent University and Bocconi University of Milan), Niccolò Mignemi and Laurent Hermes (Ecole des Hautes Etudes and Sciences Sociales in Paris). The publication contains contributions from various researchers about Mexico and six European countries. Pieter De Graef (University of Antwerp) wrote an article about urban agriculture in Belgium during the nineteenth century. He shows how commercial farms were driven out of the cities and made way for small-scale agriculture by local residents. His findings are based on agricultural statistics and cadastral series from the LOKSTAT and POPPKAD databases.

Abstract:

This book presents ten case-studies by eminent scholars dealing with food supply, storage and markets from c. 1600 to c. 2000. Together they present a long-term history of the tools to regulate the rhythms and seasonal patterns of the food production and distribution process. How were the vast flows of staple food needed for metropolitan areas organised? What practical difficulties had to be overcome to preserve this food safely? Did people respond to price patterns in search for profit? Were governments successful in imposing regulation? In dealing with these issues, the contributing authors adopt different approaches and investigate cases from England, Belgium, Germany, Austria, Italy, France and Mexico. The focus on the stocks and flows of grains and other foodstuffs raises new questions combining economic, social, political, and environmental issues in the study of agricultural markets and food policies.

Ronsijn, Wouter, Niccoló Mignemi and Laurent Herment. Stocks, season and sales: food supply, storage and markets in Europe and the New World 1600-2000. CORN Publication Series 17, 2019 Brepols, 1-224.


Crisis for whom?

DETAILS

Used database:

LOKSTAT & POPPKAD

Date:

February 2020

Category:

Scientific publication

Crisis for whom?

In the 1840s, Belgium was in the grip of an economic and social crisis. Esther Beeckaert and Eric Vanhaute (History Department, Ghent University) devote a chapter to this serious crisis in the book “An economic history of famine resilience” (Routledge 2019). They describe the crisis in its magnitude and complexity and show how strongly the consequences differed between regions. They then come to an explanation for the varying impact of the crisis. Their findings are largely based on data from population and agriculture censuses that the Quetelet Center has compiled for them. In addition, employees of the Center produced important maps for this research and the publication.

Summary:

In this paper, Esther Beeckaert and Eric Vanhaute make a regional comparison to understand the divergent impact of the 1840s potato famine in Belgium. This famine resulted from successive harvest failures in 1845 and 1846. Initially a potato blight destroyed 87 percent of the harvest and the next year the grain harvest was also partly damaged due to bad weather conditions. The authors start from the observation that the mortality rates were much higher in Inner-Flanders (Kortrijk, Roeselare, Tielt) than in Walloon Brabant (Nivelles), the Campine (Turnhout) and the Ardennes (Neufchâteau). They explain the regionally different impact on the basis of two basic characteristics of rural societies: secure and stable household access to land and performant local redistributive mechanisms through extended labour networks or public poor relief systems. In the Campine and the Ardennes considerable numbers of households were able to survive supported by systems of common access to public land. In Walloon-Brabant these common lands had largely disappeared by then, but impoverished families were relatively successfully sustained by local poor relief institutions and employed by large farms in the region. In contrast, in Inner-Flanders these safety nets were largely absent by the 1840s. Subsistence means from land and labour of many households have been reduced in the years preceding the crisis and the local poor relief institutions were not capable to meet the growing needs.  


Beeckaert, Esther and Eric Vanhaute. “Whose famine? Regional differences in vulnerability and resilience during the 1840s potato famine in Belgium.” In: Jessica Dijkman and Bas van Leeuwen (eds.) An economic history of famine resilience. Routledge, 2019: 115–41.  


Guardians of the state

DETAILS

Used database:

LOKSTAT

Date:

January 2020

Category:

Doctoral defense

Guardians of the state

Jan Naert successfully defended his dissertation on the mayors of occupied Belgium and France during the First World War on January 29. For the research, he relied, among other things, on nominative lists of mayors and population figures from the period 1900-1913 that the Quetelet Center makes available.

Summary

This study deals with the mayors who served under the German occupation of Belgium and northern France during World War I. It addresses two central questions. The first gauges the political legitimacy of the mayor and his governance during the war. Was it subject to change as a result of the occupation context? Did the definition of what ‘legitimate’ or ‘good’ governance is, acquire a different interpretation? How did mayors try to respond to that? And finally, what was the verdict at the end of the war? The second question in this dissertation assesses how the local level of administration related to the Belgian or French central state. World War I historians seem to agree nowadays that the state, and by extension the governmental authority in occupied Belgium and northern France, ‘disintegrated’ as a result of the war context. This study tests this thesis against the events at the local level. How did this disintegration process manifest itself? And how did it impact the local governance level and the functioning of the mayors? This research study answers these and other questions from of a combined transnational and local historical point of view. The analysis starts from several specific themes which are studied from the bottom up at six local case studies: Antwerp, Lille, Alost, Fourmies, Houdeng-Aimeries and Solesmes. 

PhD thesis :

Jan Naert. Hoeders van de staat: burgemeesters in bezet en bevrijd België en Noord-Frankrijk (1914-1921). PhD scriptie, Universiteit Gent, 2020.