- Home
- Ongecategoriseerd
- The 1866 Cholera epidemic in Brussels: a reconstruction
THE 1866 CHOLERA EPIDEMIC IN BRUSSELS: A RECONSTRUCTION
DETAILS
Used Datasets:
Date
Category:
Author: Isabelle Devos
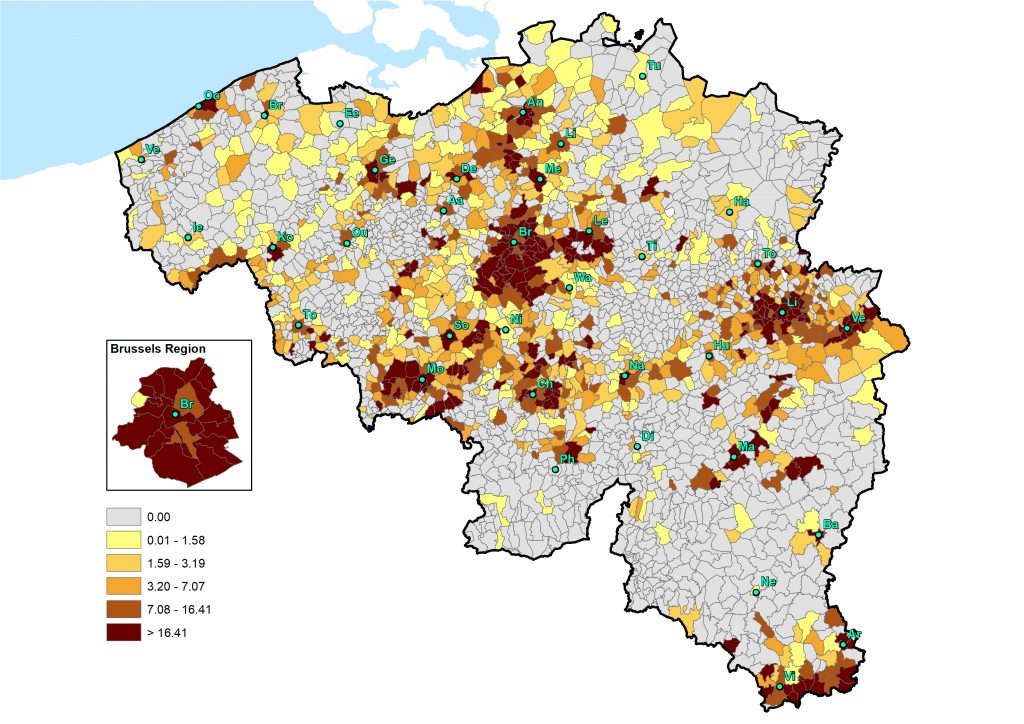
In 1866 a severe cholera epidemic raged in Belgium. The city of Brussels was hit hardest, with 3,469 cholera deaths. During the epidemic, all kinds of statistical data were collected by the city council.
The Quetelet Center has linked these data to some of its databases and so succeeded in reconstructing the course of the epidemic in the capital and determining who the main victims were.
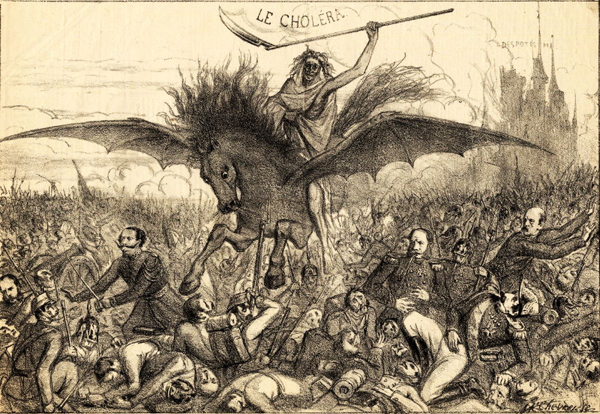
The blue death in Belgium
Cholera is a bacterial infectious disease with an incubation period of a few days. The disease is mainly spread by contaminated water. Until the late nineteenth century, people usually had to rely on (often polluted) wells and waterways for their drinking water. The main symptoms of cholera are severe vomiting, severe diarrhoea and a blue skin tone. For this reason, the disease was also called the ‘blue death’.
Barely half of the patients survived. The real cause of cholera was unknown in 1866, even though the English doctor John Snow had pointed out the dangers of polluted water as early as the 1850s. A breakthrough only came in 1883, when the German Robert Koch discovered the cholera bacterium. Previously, it was thought that the disease was caused by so-called miasmas, foul smells from polluting waterways and street refuse.
Sources: UGent Quetelet Center, HISSTER database; Documents statistiques de la Belgique, 1868.
The course of the epidemic in Brussels
Specific information on the cholera epidemic of 1866 can be found in the city archives of Brussels, including lists of names of all the people who died of cholera, including personal details such as gender, age, place of birth, occupation and address. The publications of the Brussels doctor Eugène Janssens, who had been in charge of the Brussels cause of death registration since 1862, also provide important information. By linking these data to some of our databases, such as the historical GIS Brussels (the digital map of nineteenth-century Brussels), POPPKAD (the database of the nineteenth-century Belgian cadastre) and LOKSTAT (the historical database of local statistics), we were able to reconstruct a fairly complete picture of the cholera epidemic in Brussels.
The first fatality occurred on 26 May 1866. It was the 66-year-old widow Catherine Ravaiau, a rag worker who lived with her sister on the ground floor of a house in an alley at the Vieux Marché 32. This was a very modest building that was located near the river Senne and contained several dwellings and households. In the following days two more people died of cholera, again at the Vieux Marché 32: on 27 May the four-year-old Antoinette Duval and on 28 May the 16-year-old orphan Barbe De Rauw, a seamstress. Several sick people were also reported in nearby houses, which led the mayor to have all the residents of the alley evacuated.
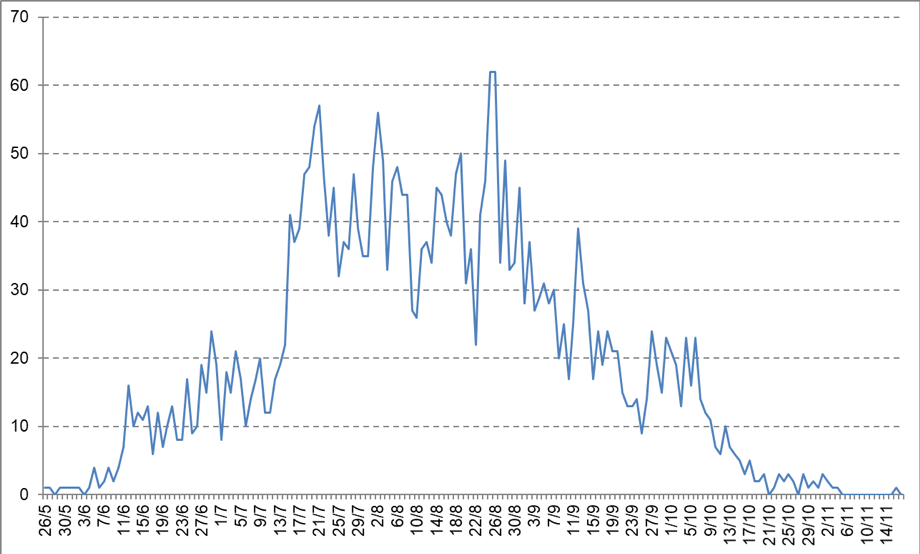
In the following weeks, the death toll in the city rose rapidly (figure 2): from mid-June there were about 15 cholera deaths a day, a month later this number had already tripled.
At that point, the hospitals in Brussels were even faced with a shortage of staff and the police had to step in to transport sick people and corpses.
The epidemic reached its peak on 25 and 26 August, with 62 deaths each day. The mortality then decreased gradually from early September.
By mid-November, almost half a year after the first death, the epidemic had burned itself out in Brussels.
The final victim was Nathalie Pollenus, the 59-year-old wife of François Lasne, a lawyer and real estate expert; she died on 16 November in their home, a townhouse at the Rue Royal 150.
Care and emergency workers
Healthcare and emergency workers were also hit hard: 7 police officers, 6 nurses, 2 gravediggers and 1 doctor did not survive the epidemic.
In many cities and municipalities, care and emergency workers who deserved recognition for their efforts during the epidemic received a medal or certificate. The Brussels city council honoured 275 people for their courage and self-sacrifice. These included police officers, poor masters who had provided material assistance and information, doctors, hospital staff, city council workers and individuals who had cared for the sick on their own initiative.
In the medical press, these awards were often met with derision. According to the doctors, the government would have done better to act against quacks or abolish the patent tax for physicians.
Criticism that sounds familiar today. For example, the one-off bonus of 300 euros as a reward for the efforts of healthcare workers during the COVID-19 epidemic over the past few months has been much commented on. And now, as then, there are loud calls for more sustainable measures (including wage increases).
Age and gender
Like the current COVID epidemic, the effects of the cholera epidemic of 1866 were strongly dependent on age and gender.
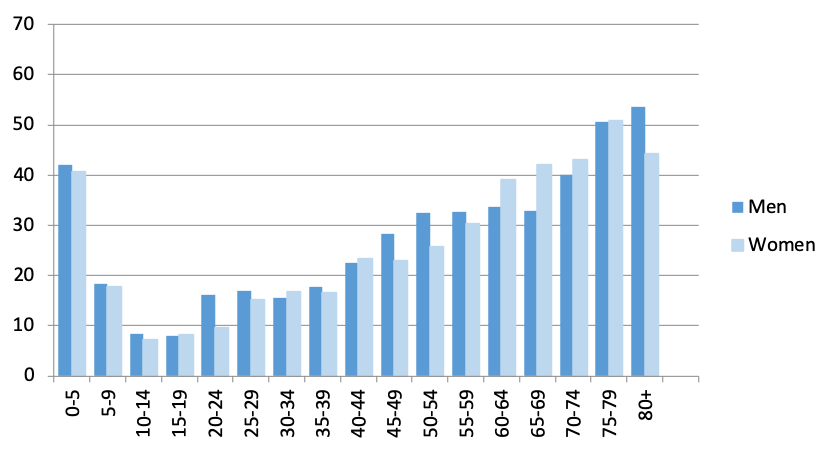
The disease claimed many victims in the age groups 0 to 10 years and 20 to 49 years. However, the number of victims in a certain group can also be higher simply because more people belong to that age category.
When we take into account the age structure (the number of inhabitants per age group) made available through the LOKSTAT database, a specific pattern emerges (figure 3).
For example, it appears that the greatest mortality risks occurred in the first years of life and in later life (60+). The lowest risk was for teenagers. Men appeared to be the most vulnerable, except in the older age groups (60-79-year-olds).
Social class
What is more difficult to determine is whether the effects of the epidemic were also strongly dependent on social class. The occupation of the deceased was mentioned on the death certificate, but this was obviously not the case for children and usually not for elderly people or women either. A good alternative to measure the wealth of the deceased is the cadastral income of the residence of the deceased (the so-called rental value). By linking the home address of the deceased to the POPPKAD database, we were able to trace the cadastral income of the cholera victims in Brussels, as we have the rental value of every house in Brussels for the years 1864-66. The data can be displayed in a historical geographic information system which was set up in the context of the POPPKAD project. This means we can closely follow the course of the cholera epidemic, day after day, since the deadly outbreak in Brussels on 26 May 1866.
As stated, the outbreak started in a working-class neighbourhood at the Vieux Marché. It spread fairly quickly to the immediate surroundings, the south and southwest of Brussels. The working-class areas in the north and around the Chaussée d’Etterbeek in the very eastern part of the city followed in mid-June. In July we also see the disease becoming more prevalent in neighbourhoods with a higher average cadastral income. In fact, it is striking that the epidemic claimed victims in all sections of the population, but that in the more affluent neighbourhoods it took several weeks before the disease hit hard. Of course, we should also take into account that the citizens in houses with a high cadastral income were not all necessarily well-off. After all, many large houses were divided into smaller dwellings and rented out.
Moreover, in order to determine the specific spatial distribution of cholera, it is also important to take into account the composition and density of the population in the different streets and neighbourhoods. Unfortunately, the historical sources do not allow us to go down to that level of detail, but we do have the number of inhabitants per street. This means we can better examine the extent to which different neighbourhoods were affected.
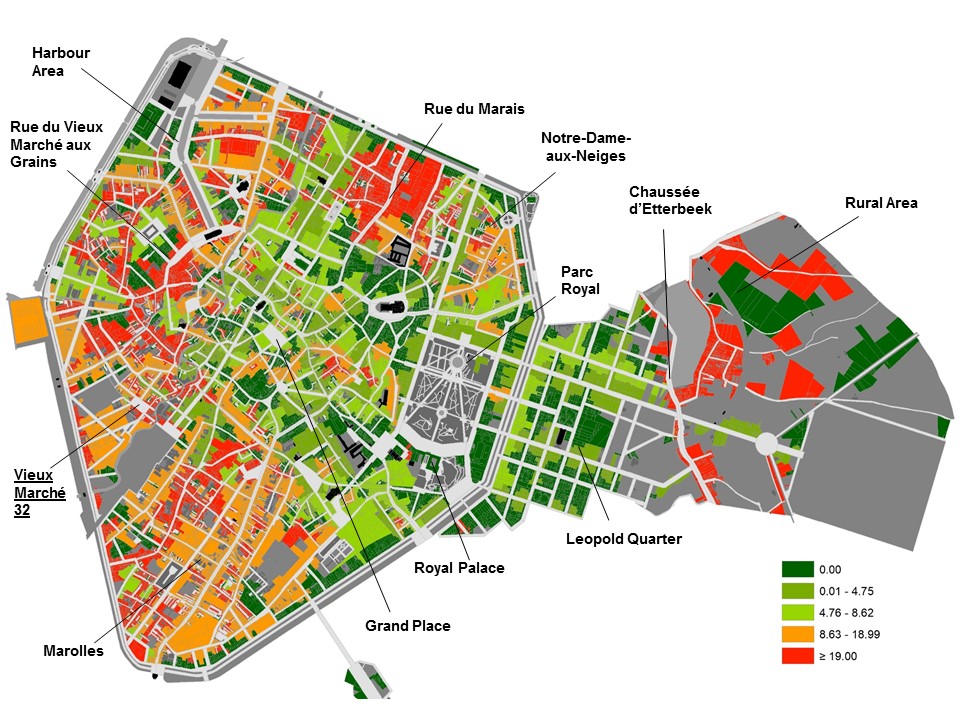
For example, we can say that the cholera epidemic manifested itself very selectively in spatial terms. Figure 4 shows that cholera wreaked havoc (red and orange areas) in the lower-lying working-class neighbourhoods in the south (Marolles), southwest (Vieux Marché) and north (harbour area and Notre-Dame-aux-Neiges) of the city.
In addition, there were many deaths in the rural area to the east of the Chaussée d’Etterbeek, where likewise numerous workers were housed in small dwellings. Most of the higher-lying neighbourhoods, on the other hand, were relatively mildly affected (green areas). This is true of the commercial districts in the city centre, the residential areas around the Royal Park and the Leopold Quarter with its numerous embassies and consulates.
Now that we know who the main victims of the cholera epidemic were, it is also important to gain a good insight into its causes. Access to clean drinking water played a central role here. Incidentally, in 1858 Brussels became the first Belgian city to have a public water supply. The city council tried to get as many people as possible to connect to the network. To that end, a number of fountains and public water pumps were even closed or removed, much to the dismay of a large section of the (poor) Brussels residents who saw this move as robbing them of their only source of water. The question is therefore whether or not the stance of the Brussels city council made the cholera epidemic of 1866 worse, but more on this in a future blog …
If you want to use one of the datasets above, do not hesitate to contact queteletcenter@ugent.be.
Or would you like to lend a hand to our new citizen science project www.sosantwerpen.be in which we, together with volunteers, will study the social inequalities in causes-of-death in the city of Antwerp (1820-1946)?
Do you want to know who were the victims of the cholera epidemic in Antwerp? Then register via sosantwerpen@ugent.be!
Sources
- Stadsarchief Brussel, politiearchief, dossiers cholera 1866.
- UGent Queteletcenter, HISSTER database 1866.
- UGent Queteletcenter, GIS Brussels 1865.
- UGent Queteletcenter, LOKSTAT database 1866.
- UGent Queteletcenter, POPPKAD database Brussels 1865.
Literature
- Département de l’Intérieur. Documents statistiques de la Belgique, 1868.
- Janssens, Eugène. Recherches statistiques sur la a mortalité dans la ville de Bruxelles, Bruxelles, 1868.
- Falise, Claudine. “Le cholera à Bruxelles en 1866”, Annales de la Société belge d’histoire des hôpitaux, 17(1979): 81-104.
- Viré, Louis. La distribution publique d’eau à Bruxelles, Bruxelles, 1973.