From textiles to tobacco: Flemish industry in 1738.

DETAILS

Used Dataset:

STREAM

Date:

December 2023

Category:

Publication

From textiles to tobacco: Flemish industry in 1738

How was industry faring in Flanders in the first half of the 18th century? Wouter Ryckbosch and Anne Winter (VUB) investigated industrial production and labor in nineteen Flemish towns in 1738. Using the industrial survey from that year, the results of which are available in STREAM, they examined the extent and nature of urban industries, the role of craft guilds, and local labor relations.

Their analysis confirms the dominance of textile production and guild crafts in the examined towns. The research also reveals the presence of industries focused on consumption, such as the manufacturing of glass, tobacco, and soap. While these industries were numerically marginal at the time, they would experience significant growth in the second half of the century. The study also indicates that these sectors were less organized on a craft guild basis and had a higher degree of proletarianization.

Article:

Ryckbosch, Wouter and Winter, Anne. “Between corporatism and capitalism? Urban industry and labor in eighteenth-century Flanders”, TSEG – The Low Countries Journal of Social and Economic History, 20 (2023): 37-80.

Interdisciplinary research with COST-Action ‘The Great Leap’

DETAILS

Used Dataset:

HISSTER, S.O.S. Antwerp

Date:

June 2023

Category:

Interdisciplinary collaboration

INTERDISCIPLINARY RESEARCH WITH COST ACTION 'THE GREAT LEAP'

Isabelle Devos from the Quetelet Center is the co-supervisor of the COST Action ‘The great leap. Multidisciplinary approaches to health inequalities, 1800-2022 (GREATLEAP)’.

COST Action is an interdisciplinary research network that brings researchers and innovators together to investigate a topic of their choice for 4 years. COST Actions are typically comprised of researchers from academia, SMEs, public institutions, and other relevant organizations or interested parties.

Embracing the COST Mission, the Great Leap takes a unique, multidisciplinary approach from a historical perspective to understand better the roots and drivers of health inequalities across regions and countries in Europe and beyond. To achieve this mission, the Great Leap creates an international, multidisciplinary network that will bundle expertise, techniques, insights, and data to create

(1) the first international comparable dataset of individual-level historical cause of death data,

(2) innovative analytical tools to analyze it, and

(3) insights into how this information can be used in current public health policy and practice.

The network includes a wide range of academic expertise in history, social sciences, life sciences, and epidemiology and involves university-, research-, government- and (international) health institutes and organizations, including statistical offices and national archives. 

By fostering the strengths of this unique, multidisciplinary, and diverse network, the Great Leap aims to generate ground-breaking insights into the historical roots and drivers of health inequalities across regions and countries in Europe and beyond.

Interested parties can apply here to participate in one or more of the five working groups of the Cost-Action. 

An award for S.O.S. Antwerpen

DETAILS

Used dataset:

S.O.S. ANTWERP

Date:

14 November 2023

Category:

Database

S.O.S. ANTWERPEN RECEIVES PRESTIGIOUS DISTINCTION

Isabelle Devos, Sarah Heynssens and Sven Vrielinck were awarded an Annual Prize for Science Communication by the Royal Flemish Academy of Belgium (Koninklijke Academie van België) and the Young Academy (Jonge Academie) for the project S.O.S. Antwerp

In the citizen science project on demography and death in Antwerp, citizens not only participated in data collection and analysis, they were also encouraged to engage in historical research themselves. The jury awarded S.O.S. Antwerp the distinction because, thanks to training, assignments and exchanges with team members, citizens gained real insight into the process of science . 

You can learn more about the database that resulted from this project here:

POPPKAD surpasses 10,000 users

DETAILS

Used dataset:

POPPKAD

Date:

September 2023

Category:

Database

POPPKAD surpasses 10,000 users

POPPKAD, the database of the Belgian land registry from the nineteenth century, is gaining popularity among a wide audience. Researchers, local historians, genealogists, and other enthusiasts are increasingly exploring the database, which contains the names of 540,000 property owners from the mid-19th century in over 1,000 Belgian municipalities. According to the latest statistics, 10,000 users have extensively utilized the website. The top 5 most searched terms include (not surprisingly) the names Janssens, Peeters, Willems, Maes, and De Smet. On the project website, you can not only discover the most common surnames but also access scans of the original land registry records. These records provide detailed information about property owners, buildings, and lands from the nineteenth century. Preliminary figures indicate that over 25,000 records have been downloaded from the site after consulting the database. 

Explore the rich past via POPPKAD!

The demise of keuter farms in Coastal Flanders

DETAILS

Used dataset:

STREAM

Date:

January 2023

Category:

Scientific publication

The demise of keuter farms in Coastal Flanders

Farms were under tremendous pressure during wars. In addition to the destruction and the diseases spread by the roaming bands of armies, the governments or occupiers also increased the tax burden. This burden was so high that some farms went bankrupt. 

In Coastal Flanders, the wars went hand in hand with farm expansion in the 17th and 18th centuries, with large (tenant) farmers gobbling up the downtrodden small- and medium-sized farms. This indicates that large (tenant) farmers were better able to withstand the heavy pressure of rising taxes. 

Combining accounting data from farms and tax collector accounts, Sander Berghmans (UGent, Dep. History) shows that taxes played a crucial role in the enlargement of farms in Coastal Flanders. First, his research showed that taxes were a very important expense for farms, especially during wars. Second, he was able to proof that large farms were able to secure payment deferrals. 

Although granting payment deferrals was not allowed by local governments, it was found that local tax collectors did so for large farms. Large farms possessed the social and economic power to obtain payment deferrals from the tax collector. Smaller and medium-sized farms did not have this power and were therefore declared bankrupt very rapidly in the event of arrears. Their abandoned farms could then be leased for little money by the large farms. Territorial data from the STREAM-database were used for the spatial representation of data in this study.

The deadliest World War

DETAILS

Used database:

LOKSTAT

Date:

September 2022

Category:

Scientific publication

The deadliest World War

The death toll of both World Wars in Belgium is still unclear and different figures circulate. The uncertainty about the number of military and civilian casualties is due to gaps in source material and the lack of reliable statistics. Bruno De Wever (UGent, Department of History) ventured a calculation by combining and critically evaluating various sources and databases compiled in recent years.  In doing so, he used LOKSTAT among others. The results of his research recently appeared in the Liber Amicorum of Piet Chielens. 

The author concludes that the death toll of World War I was greater for Belgians both in absolute numbers and in relative terms than World War II (66,000 or 8.86‰ versus 53,000 or 6.42‰). But if we include the foreigners who stayed on Belgian soil during the war years (especially Jewish refugees and migrants), World War II claimed more victims (79,000 dead or 9.57‰ of the population). A detailed statistic distinguishing the size of the different categories of civilian and military victims can be found in the cited contribution. 

Publication:

Bruno De Wever, “‘Belgische oorlogsdoden van de wereldoorlogen”, in: Nous irons en Flandres: Festschrift Piet Chielens. Ypres, 2022, 361-365.

Markets in Flanders through the early modern period

MARKETS IN FLANDERS THROUGH THE EARLY MODERN PERIOD

DETAILS

Used database:

STREAM

Date:

May 2022

Category:

Blog post

Author: Wouter Ronsijn 


The Ghent flower market celebrates its 250th anniversary this year and is probably the oldest flower market in Flanders. Apparently, flowers were first sold on Ghent’s Kouter square by the horticulturalist Toontje Verstuyft in 1772 on the first Sunday in June. 

Until the late twentieth century, local weekly markets played a central role in the economic and social life of village and urban dwellers. In those days, people could buy not only flowers but also a wide variety of products. Wouter Ronsijn (UGent) has used the STREAM database to reconstruct the development of weekly markets in the county of Flanders between ca. 1550 and 1800. Where could people go? And on which days?

Weekly, monthly and annual markets

For centuries, local markets played a central role in the economic and social life of village and urban dwellers. We have put together an overview of all the places in the county of Flanders that had an official or unofficial market between 1550 and 1800, based on market applications and rights, official surveys and summaries compiled in the STREAM database. These were physical markets: gatherings of buyers and sellers at specific places and times. The word ‘market’ comes from the Latin mercatus. Male and female farmers came there to sell food (such as grain, potatoes, butter, eggs, poultry) or raw materials (such as flax, kemp, oilseeds). Vendors came to the market with consumer goods (pots, pans and so on), and butchers and fishmongers also often sold their wares there. Weekly markets were more focused on selling goods for daily use (food but also raw materials). Monthly markets often served to sell livestock, while annual markets offered a wider range of consumer goods or hosted large horse markets. Ghent had one of the oldest annual markets, the so-called Bamisfoor, which was held on 1 October to mark the feast of Saint Bavo. This fair is said to go back to the ninth or tenth century. In the Middle Ages, the annual markets of Torhout, Lille, Ypres, Messines and Bruges formed a cycle of successive fairs, with each one lasting a month. In the Duchy of Brabant, the annual markets of Antwerp and Bergen-op-Zoom were the most important. These physical gatherings at specific places and times provided a practical solution for helping buyers and sellers find each other. Trade always involves two parties, and markets bring those parties together. Moreover, markets made trade more transparent because they offered insights into supply and demand and so influenced prices.

Number of weekly markets

According to some sources, Count Baudouin III established weekly markets in Bruges, Kortrijk, Torhout and Roeselare in 958. This would make them among the oldest markets in Flanders, but today historians doubt whether this claim is correct. The origins of the first markets in Flanders are shrouded in mystery. Nevertheless, it is probably true that several Flemish markets have their roots in the High Middle Ages (1000-1250) or earlier. As the population of Flanders increased and trade grew, so did the number of markets in the long run. According to the historian Peter Stabel, sixteenth-century Flanders was a region with many cities and market centres and several new centres were added in that century.

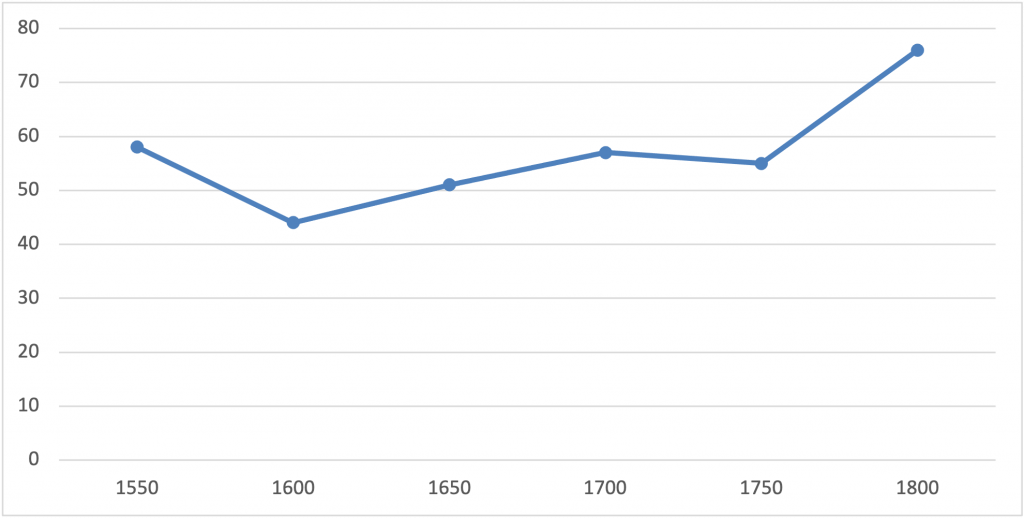
We have enough sources to follow this evolution numerically, starting from the early modern period. We examined which places had a weekly market for six points in time (1550, 1600, 1650, 1700, 1750 and 1800), and on which day of the week the market (or the main market) took place. This shows that around 1550, with almost 60 markets, Flanders already had a dense market network (see Graph 1). In the second half of the sixteenth century, however, the number of markets declined sharply, in the wake of the economic disruption and demographic losses at the beginning of the Eighty Years’ War (1568-1648). Around a quarter of all markets had disappeared by around 1600, and it took until around 1700 for Flanders to once again have about as many markets as it held around 1550. The growth in the number of markets was especially strong after the middle of the eighteenth century. Between 1750 and 1800, more than 20 markets were added, so more than a third of the number of existing markets. In the nineteenth century, this number increased even further. Around 1868, the provinces of East Flanders and West Flanders had no fewer than 110 markets. However, due to the rise of retail trade and supermarkets, most markets disappeared in the course of the twentieth century.

Graph 1: Total number of markets in Flanders, 1550-1800 (Source: Ghent University, Quetelet Center, STREAM database)

Friday (no) market day?

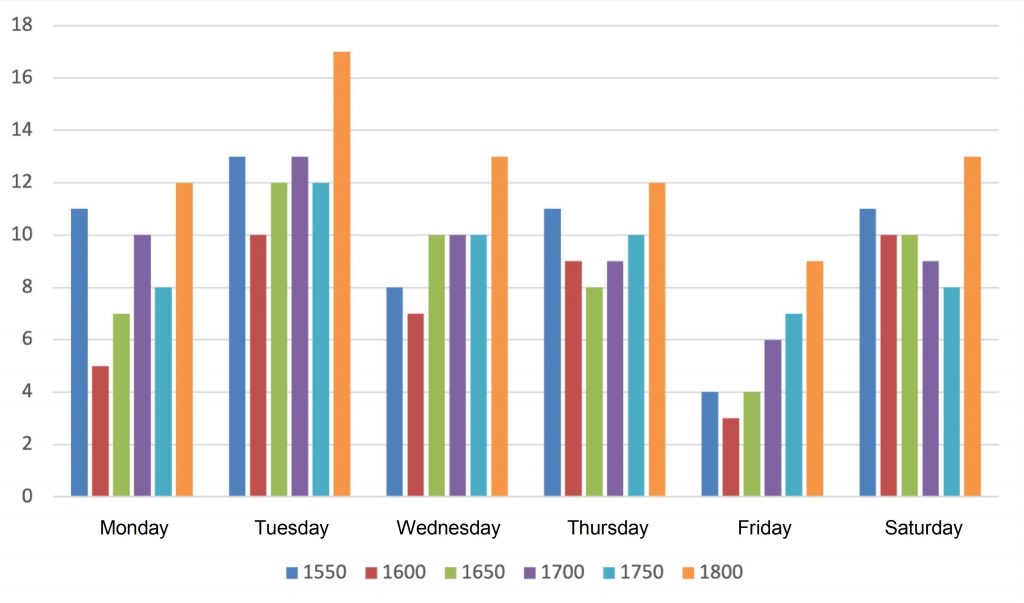
In the early modern period, the markets were rather evenly spread over the different weekdays, except that there were no markets on Sundays and few on Fridays (see Graph 2). In the Middle Ages, there were still several places with a Sunday market, such as Assenede and Stekene, but they were moved at some point. There were exceptions, such as the markets for birds, flowers and potatoes that were held on Sundays in Ghent ca. 1800. The fact that there were few markets on Fridays may have had to do with the sobriety inspired by the Catholic rule of not eating meat on that day. However, it may also have had to do with the fact that Friday was the main market day in Ghent. The city of Ghent did not tolerate any competing markets on that day and new marketplaces probably did not want to compete with Ghent either. When establishing new markets, people often chose days when there were no other markets being held in the area. As the Flemish market network grew denser, more and more markets were added on Fridays.

Graph 2: Number of markets per weekday, 1550-1800 (Source: Ghent University, Quetelet Center, STREAM database)

Official and unofficial

It is likely that many official markets evolved from older informal markets, established without the impetus of the local government. Local authorities had various reasons for giving such informal markets an official character. Recognition contributed to the security and stability of the market. In this way, the market no longer had to continue hiding in the shadows of public spaces. The safety of market visitors was sometimes explicitly guaranteed in the rights by which they were recognised. In addition, this recognition made it easier for the government to monitor the trade that took place there. Official recognition of markets, and the prohibition of trade outside them, made it possible to inspect the quality of the merchandise, gain a better insight into the supply to towns and villages, take note of (and possibly influence) the prices at which goods were sold, and to control the weights and measures used for making calculations.

Moreover, taxes could then be levied on market trade, which in turn was a reason for buyers and sellers to avoid official markets and meet elsewhere, on the informal circuit. Official recognition was also sought to make it easier for inhabitants to buy raw materials or food, or to sell their products and to support the activities of innkeepers and shopkeepers, who saw a part of the profits made at the market immediately spent at their establishments. In addition, a market also gave a village prestige.

However, economic or fiscal considerations were not the only factors that played a role in the creation of markets. Markets and fairs were not just places where goods were traded or taxes levied. They also provided an opportunity for entertainment, for spreading news or rumours, and for protest and conflicts. For farmers, market day was not only the day on which money could be made from the sale of agricultural products, it was also the day on which people went to town in their Sunday best to hear the latest news or to buy fashionable new items. Notaries were also busier on market days. Many people came together at successful markets, which could pose a threat to public order. Sometimes the somewhat moralising objection was made, especially when fairs were established, that these were days of drunkenness and idleness.

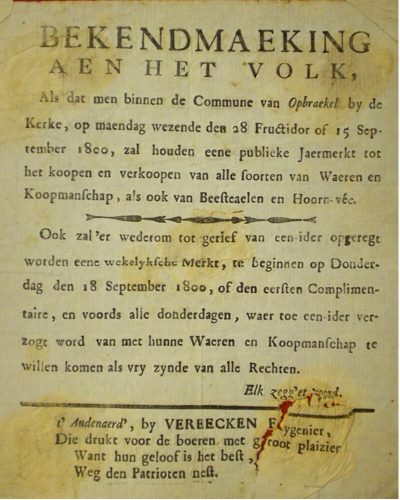
Putting together the above overview was not a straightforward task and what has been presented here cannot claim to be complete. The case of Opbrakel is a good example of the difficulties in constructing the overview. In a survey from the early 1800s, the mayor of Opbrakel stated that his municipality did not have a market. An attempt a few years earlier to establish a market was met with resistance from the neighbouring marketplaces of Nederbrakel and Geraardsbergen, and came to nothing because the central government did not grant permission. This permission had been necessary since the Middle Ages, until it was abolished in 1870. But in fairness, the mayor did admit in the same survey that the inhabitants of his village usually gathered every Thursday, including in inns, to trade small goods among themselves for the needs of their families.

Aankondiging van de herinrichting van een markt in Opbrakel, 1800. Het ging om een officieuze markt zonder toestemming van de centrale overheid (Bron: Rijksarchief Gent, Scheldedepartement, 2315/5)
Announcement of the re-establishment of a market in Opbrakel, 1800.

It was an unofficial market without permission from the central government (Source: Rijksarchief Gent, Scheldedepartement, 2315/5)

Was this a market then or not? Activities that could be considered markets took place outside officially recognised markets as well. These were sometimes genuinely informal markets that were at times tolerated and at other times opposed. Conversely, some official markets existed only on paper, while in reality they were hardly visited. However, we often know more about these official markets precisely because of their official character. In the next blog post we will show where these markets were located.


Sources

  • UGent Quetelet Center, STREAM database.

Literature

  • Blockmans, F., “L’équipement commercial de la Flandre avant 1300”, Annales de la Fédération archéologique et historique de Belgique, 1938, pp. 273-286.
  • Carlier, J. J., “Origine des foires et des marchés publics en Flandre”, Annales du Comité Flamand de France, 1861-1862, 6, pp. 127-139.
  • Stabel, Peter. De kleine stad in Vlaanderen.  Brussels, Paleis der Academiën: 1995.
  • Stabel, Peter. Dwarfs among giants. Leuven, Garant: 1997. 
  • Van Damme, Ilya. Verleiden en Verkopen. Amsterdan, Aksant: 2007.
  • van Bavel, Bas. Manors and Markets. Oxford, Oxford University Press: 2010.
  • van Houtte, J. A., “Les foires dans la Belgique ancienne”, La foire. Brussels, Éditions de la librairie encyclopédique: 1953, pp. 175-207.
  • Viaene, Antoon, “Duizend jaar markt te Roeselare”, Biekorf, 1958, 59, pp. 369-372.
  • Verhulst, Adriaan, “De vroegste geschiedenis en het ontstaan van de stad Gent”, Handelingen der Maatschappij voor Geschiedenis en Oudheidkunde te Gent, 1972, 26(1): 5-39.
  • Ronsijn, Wouter. Commerce and the Countryside. Gent, Academia Press: 2014.
  • For a recent overview, see www.markten.be and www.belgischemarkten.be

If you want to use one of the dataset mentioned above, do not hesitate to contact queteletcenter@ugent.be

Always a market nearby? The market network in Flanders through the early modern period and the nineteenth century

ALWAYS A MARKET NEARBY? THE MARKET NETWORK IN FLANDERS THROUGH THE EARLY MODERN PERIOD AND THE NINETEENTH CENTURY

DETAILS

Used Dataset

STREAM

Datum:

June 2022

Category:

Blog post

Author: Wouter Ronsijn


Nowadays, the flower market of Ghent, the bird market of Antwerp and the antiques market of Tongeren are mainly tourist attractions, but where could one go in the past for the weekly market? In the previous blog post, Wouter Ronsijn (UGent) showed how many markets were held in the county of Flanders during the early modern period. In this month’s contribution we learn where markets used to be organised and how this pattern evolved over time.

Old and new markets

In the previous post we discussed the evolution of the number of markets between ca. 1550 and 1800, and the days on which those markets took place. Besides chronological patterns, there were also geographical patterns in the Flemish market network. The overview of Flemish weekly markets between 1550 and 1800, prepared for the STREAM project, has now been transformed into a map. This was enabled by the historical geographical reference system of the STREAM database.

Play Video

When we compare the maps, we see a shift from coastal Flanders to inland Flanders over the long term. Several markets in coastal Flanders that disappeared after 1550 did not return and there were few new markets in other places in the coastal region. In contrast, many new markets were established in inland Flanders. This trend is undoubtedly linked to the population stagnation in coastal Flanders and the strong demographic growth in inland Flanders.

The markets that were established between 1550 and 1800 were not always new markets. Sometimes markets lapsed for a period and were then restarted. For example, the application for a market in Sint-Lievens-Houtem in 1783 was supported by the various testimonies of elders from the neighbourhood. They had heard from their parents and grandparents that there used to be a market in this village, which had been brought to an end by war.

In addition to the many wars that disrupted life, fluctuations in the establishment of markets were linked to the economic and demographic situation, to power shifts between urban and rural areas, and between higher and lower levels of government. After all, the functioning of markets also depended on potential rivals who could use political power to prevent competition. It was only after 1870 that it was no longer necessary to obtain permission from higher authorities to establish a market and that municipalities could decide on this themselves.

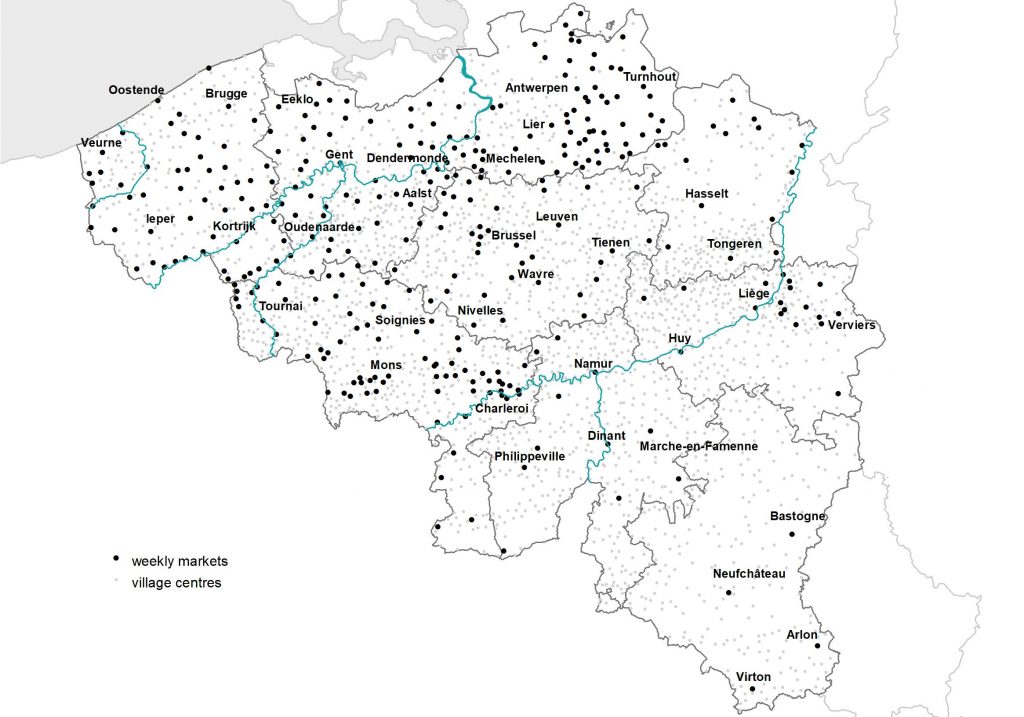
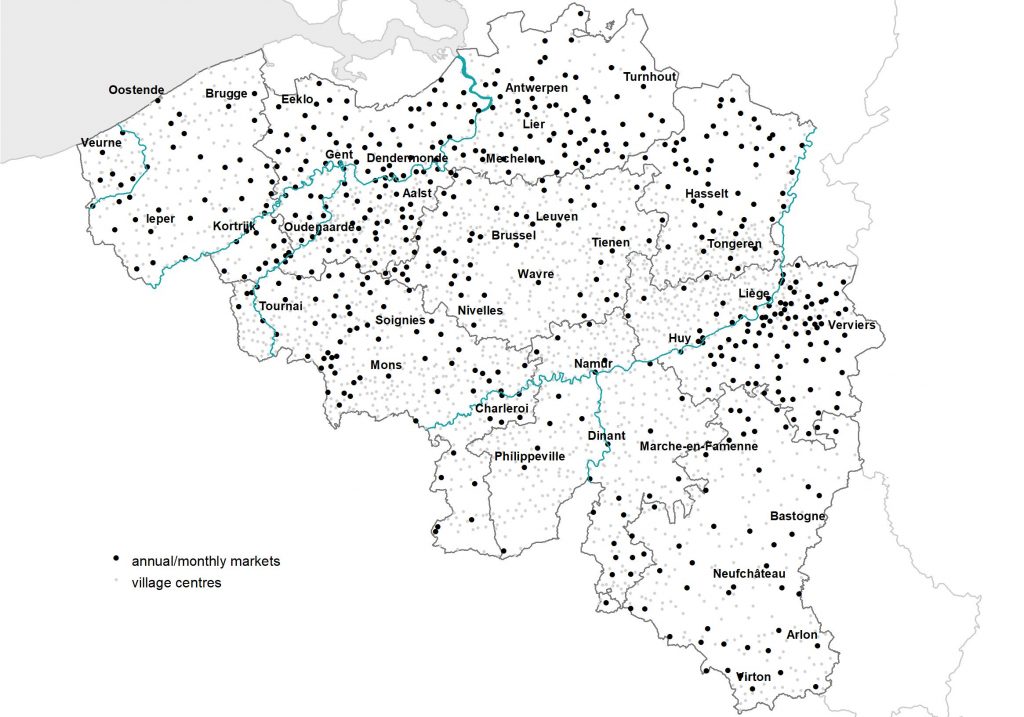
Based on the Farmers’ Yearbook, we can indicate on a map for the whole of Belgium in 1868 where there were weekly (see map 1) and annual markets (see map 2). As far as we know, this is not possible for earlier periods due to a lack of sources.

Map 1: Weekly markets in Belgium, 1868 Source: Annuaire des agriculteurs pour 1868.
Annual or monthly markets in Belgium, 1868 Source: Annuaire des agriculteurs pour 1868.

Note: Because it is sometimes difficult to make the distinction between annual and monthly markets (some municipalities had up to 12 annual markets, making them essentially a monthly market), both have been taken together here.

Large regional differences

The maps immediately make it clear that there were enormous regional differences in Belgium. This is primarily, but not exclusively, due to settlement patterns and population density. Obviously, more markets can be found in areas where the land is divided into many small villages than in areas with only a few sprawling villages. This was the case, for example, in East Flanders and West Flanders, where there were many weekly markets, but not in Haspengouw, where nevertheless there were also many small municipalities. Furthermore, there were many markets in the densely populated, emerging Walloon industrial areas around Mons, La Louvière, Charleroi and to a lesser extent Liège, though also in the much less densely populated Antwerp Campine almost all municipalities had a market. South of the Sambre and Meuse rivers, where few people lived, there were also few markets.

The map for 1868 further reveals that, in addition to settlement patterns and population density, regional economic differences also played a role. The many weekly markets in the Antwerp Campine mainly served to allow local farmers to sell their butter, destined for the big cities among other places, at advantageous prices, whereas the markets in the Walloon industrial areas were probably mainly intended to ensure supplies to local consumers. Annual markets, which in the nineteenth century still played a role in the cattle trade, were remarkably common in the pasturelands around Liège, among other places.

Finally, there are also traces of the power that cities were long able to exercise over nearby rural areas. For example, there are remarkably few markets in the immediate surroundings of a few large cities such as Bruges, Ghent, Antwerp and Brussels. Nevertheless, there were already markets in some municipalities that bordered on those large cities and which were probably already part of the urban agglomeration, such as Borgerhout near Antwerp as well as Schaarbeek and Sint-Jans-Molenbeek near Brussels.

The struggles, physical and verbal, that have been waged over the centuries in and around markets clearly show the importance of this institution. The right to hold markets was contested between urban and rural areas. Buyers and sellers, men and women, farmers, vendors, craftsmen and shopkeepers all fought for access to markets. Markets provided access to and control over trade flows, a direct source of income for sellers, sometimes indirectly for the shopkeepers and innkeepers who welcomed more people on market days, and for authorities that collected taxes at markets. Knowledge of the development of these specific markets is essential for a good understanding of daily life in the past.
If you want to use one of the dataset mentioned above, do not hesitate to contact queteletcenter@ugent.be

Sources

  • UGent Quetelet Center, STREAM database.
  • Annuaire des agriculteurs pour 1868, Brussels, Tarlier. 

Literature

  • Stabel, Peter. De kleine stad in Vlaanderen. Brussels, Paleis der Academiën: 1995.
  • Stabel, Peter. Dwarfs among giants. Leuven, Garant: 1997.
  • Van Damme, Ilya. Verleiden en Verkopen. Amsterdan, Aksant: 2007.
  • van Bavel, Bas. Manors and Markets. Oxford, Oxford University Press: 2010.
  • Ronsijn, Wouter. Commerce and the Countryside. Ghent, Academia Press: 2014.
  • Ronsijn, Wouter. “Het wettelijke land en het werkelijke land: wetgeving en praktijk bij het houden van openbare markten in België, negentiende eeuw”, Handelingen van de Koninklijke Zuidnederlandse Maatschappij voor Taal- en Letterkunde en Geschiedenis, 2016, 69, pp. 217-232.
  • For a recent overview, see www.markten.be and www.belgischemarkten.be

Wind and water power in 1774

DETAILS

Used database:

STREAM

Date:

September 2021

Category:

Scientific publication

WIND AND WATER POWER IN 1774

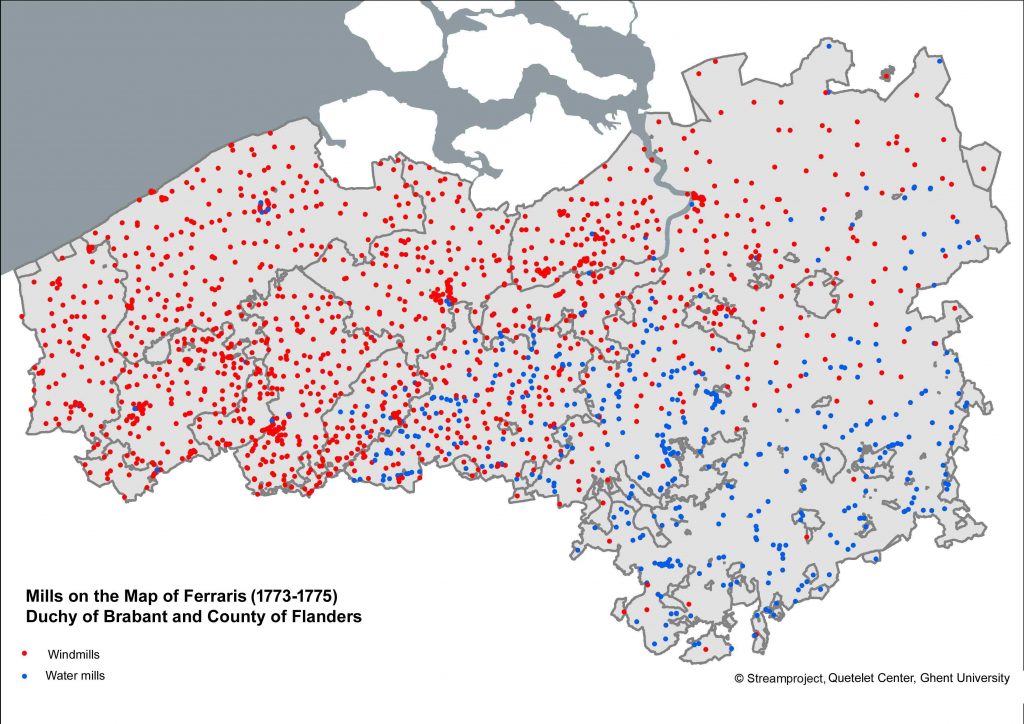
Before the advent of steam engines, mills were the most ingenious machines in common use. The oldest existing mill in the Low Countries dates from 1183 and was built in Wormhout. Important applications of mills were grinding grain, pumping water and sawing wood.

The Quetelet Center made a detailed survey map of the mill distribution based on the Ferraris map around 1774 (database STREAM) . This map was published in an article by Alain Goublomme (chairman of Molenforum Vlaanderen and Oost-Vlaamse Molens vzw) and Wouter Ronsijn (researcher of the Bocconi University in Milan and UGent) on the occasion of the expo Naar molens kijken (looking at mills) at the heritage site Ename. The red dots are windmills concentrated in the northwest and north. The blue dots represent water mills which were mainly to be found in areas with differences in altitude.

Article:

Alain Goublomme, Wouter Ronsijn. “Kijken naar molenland”. G/oud: geschiedenis van Oudenaarde en Omgeving, 1, (2021):  32-39.

Ostend measured and counted

DETAILS

Used database:

POPPKAD

Date:

October 2021

Category:

Scientific publication

OSTEND MEASURED AND COUNTED

Ostend was an important port that developed into a bustling city and tourist centre in the course of the nineteenth century. A large part of this past is still shrouded in darkness by the disastrous destruction of important archival collections during and after the Second World War. Authors Pieter François (University of Oxford, Centre for Study of Social Cohesion) and Luc François (Professor Emeritus of History UGent) partly fill this gap with a remarkable and rare study of the Ostend land register on the eve of the Belgian revolution. They describe in detail the spatial organisation, the housing, the port buildings, the landowners, the tenants and the distribution of wealth on the basis of the real estate data collected by the cadastre in 1829-1834. The Quetelet Center processed the data at house level in overview maps.

Article:

Luc François en Pieter François. “Oostende gemeten en geteld: het kadaster van net vóór 1830”, in Als spaken van een tredmolen: gedenkwaardige en- of historische feiten, De Plate. Jubileumboek, 36(2021), 81-95.


The impact of Belgian transport policy

DETAILS

Used dataset:

LOKSTAT

Date:

August 2021

Category:

Scientific publication

THE IMPACT OF BELGIAN TRANSPORT POLICY

In the course of the nineteenth century, Belgium underwent a radical transformation in terms of mobility. In barely half a century, mobility increased enormously with the advent of the railways and the expansion of the transport network. The role that the transport policy played in this transition has not yet been sufficiently studied. Historian Ingrid Schepers (University of Antwerp) investigates the connecting function of the Belgian railways by means of relational geography and combined various forms of mobility. She shows how much the transport policy was decisive for labour mobility and the complex relationship between city and countryside. For her research, she used commuter data and census data from LOKSTAT.

Article:

Ingrid Schepers. “Vertrekken, blijven of beide? De invloed van het Belgische transportbeleid op de arbeidsmobiliteit van de plattelandsbevolking tijdens de negentiende eeuw?”, in Stadsgeschiedenis, 16(2021), 1, 3-20.

The 1866 Cholera epidemic in Brussels: a reconstruction

THE 1866 CHOLERA EPIDEMIC IN BRUSSELS: A RECONSTRUCTION

DETAILS

Used Datasets:

GIS BRUSSELS, HISSTER, POPPKAD & LOKSTAT

Date

September 2020

Category:

Publication & video

Author: Isabelle Devos

In 1866 a severe cholera epidemic raged in Belgium. The city of Brussels was hit hardest, with 3,469 cholera deaths. During the epidemic, all kinds of statistical data were collected by the city council. 

The Quetelet Center has linked these data to some of its databases and so succeeded in reconstructing the course of the epidemic in the capital and determining who the main victims were.


The blue death in Belgium

Belgium was struck by cholera seven times in the nineteenth century. The epidemic of 1866 was the worst, with 43,400 victims. Some 1 million cholera deaths were recorded in Europe at that time. 

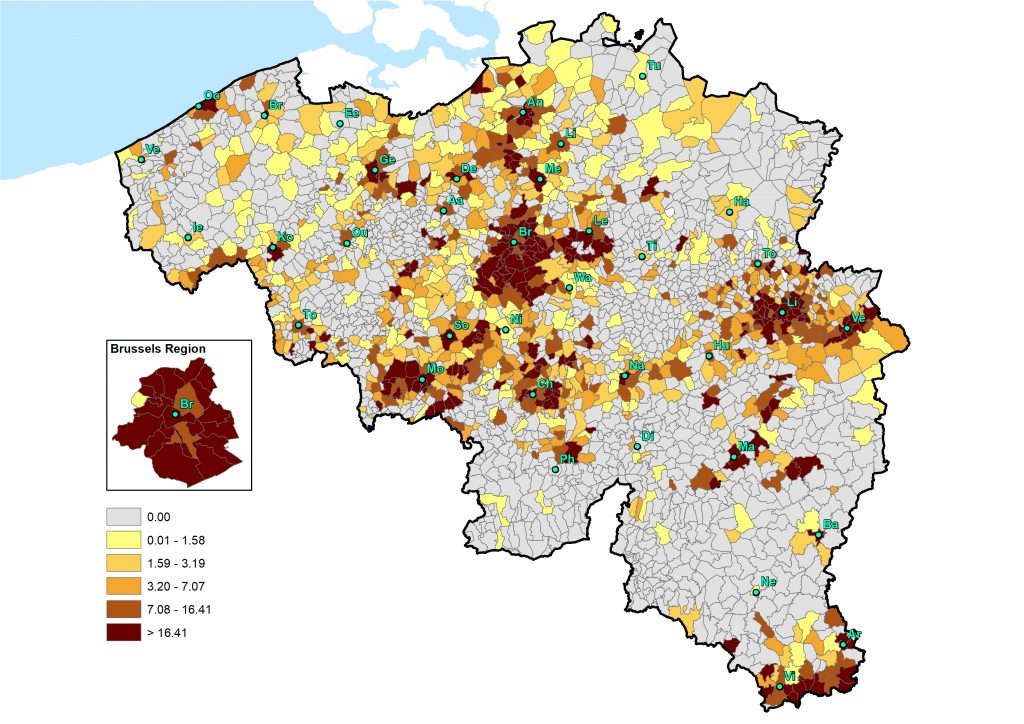
Cholera entered the country in the month of March from different directions and claimed many victims until early December, peaking in the summer. There were a large number of deaths, especially in the cities and surrounding municipalities (figure 1). The city of Brussels, with 3,469 cholera deaths, was hit hardest.

Cholera is a bacterial infectious disease with an incubation period of a few days. The disease is mainly spread by contaminated water. Until the late nineteenth century, people usually had to rely on (often polluted) wells and waterways for their drinking water. The main symptoms of cholera are severe vomiting, severe diarrhoea and a blue skin tone. For this reason, the disease was also called the ‘blue death’. 

Barely half of the patients survived. The real cause of cholera was unknown in 1866, even though the English doctor John Snow had pointed out the dangers of polluted water as early as the 1850s. A breakthrough only came in 1883, when the German Robert Koch discovered the cholera bacterium. Previously, it was thought that the disease was caused by so-called miasmas, foul smells from polluting waterways and street refuse.

Figure 1. Crude cholera mortality rates by municipality (number of deaths per 1,000 inhabitants), Belgium, 1866.


Sources: UGent Quetelet Center, HISSTER database; Documents statistiques de la Belgique, 1868.

The course of the epidemic in Brussels

Specific information on the cholera epidemic of 1866 can be found in the city archives of Brussels, including lists of names of all the people who died of cholera, including personal details such as gender, age, place of birth, occupation and address. The publications of the Brussels doctor Eugène Janssens, who had been in charge of the Brussels cause of death registration since 1862, also provide important information. By linking these data to some of our databases, such as the historical GIS Brussels (the digital map of nineteenth-century Brussels), POPPKAD (the database of the nineteenth-century Belgian cadastre) and LOKSTAT (the historical database of local statistics), we were able to reconstruct a fairly complete picture of the cholera epidemic in Brussels.

The first fatality occurred on 26 May 1866. It was the 66-year-old widow Catherine Ravaiau, a rag worker who lived with her sister on the ground floor of a house in an alley at the Vieux Marché 32. This was a very modest building that was located near the river Senne and contained several dwellings and households. In the following days two more people died of cholera, again at the Vieux Marché 32: on 27 May the four-year-old Antoinette Duval and on 28 May the 16-year-old orphan Barbe De Rauw, a seamstress. Several sick people were also reported in nearby houses, which led the mayor to have all the residents of the alley evacuated. 


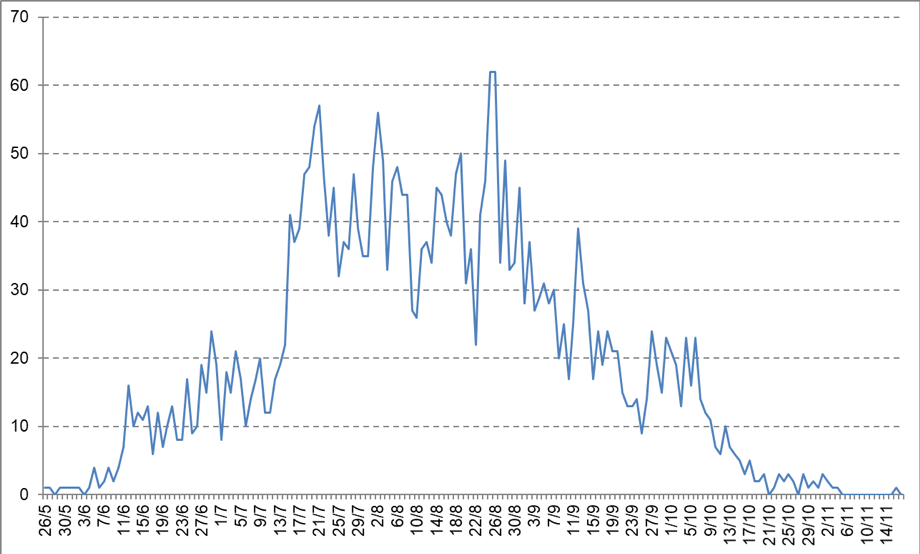
Figure 2. Number of cholera deaths per day, Brussels, 26 May-16 November 1866.
Source: Archives of the City of Brussels, Police, red series 83-86.

In the following weeks, the death toll in the city rose rapidly (figure 2): from mid-June there were about 15 cholera deaths a day, a month later this number had already tripled. 

At that point, the hospitals in Brussels were even faced with a shortage of staff and the police had to step in to transport sick people and corpses. 

The epidemic reached its peak on 25 and 26 August, with 62 deaths each day. The mortality then decreased gradually from early September. 

By mid-November, almost half a year after the first death, the epidemic had burned itself out in Brussels. 

The final victim was Nathalie Pollenus, the 59-year-old wife of François Lasne, a lawyer and real estate expert; she died on 16 November in their home, a townhouse at the Rue Royal 150.


Care and emergency workers

Healthcare and emergency workers were also hit hard: 7 police officers, 6 nurses, 2 gravediggers and 1 doctor did not survive the epidemic. 

In many cities and municipalities, care and emergency workers who deserved recognition for their efforts during the epidemic received a medal or certificate. The Brussels city council honoured 275 people for their courage and self-sacrifice. These included police officers, poor masters who had provided material assistance and information, doctors, hospital staff, city council workers and individuals who had cared for the sick on their own initiative. 

In the medical press, these awards were often met with derision. According to the doctors, the government would have done better to act against quacks or abolish the patent tax for physicians. 

Criticism that sounds familiar today. For example, the one-off bonus of 300 euros as a reward for the efforts of healthcare workers during the COVID-19 epidemic over the past few months has been much commented on. And now, as then, there are loud calls for more sustainable measures (including wage increases).


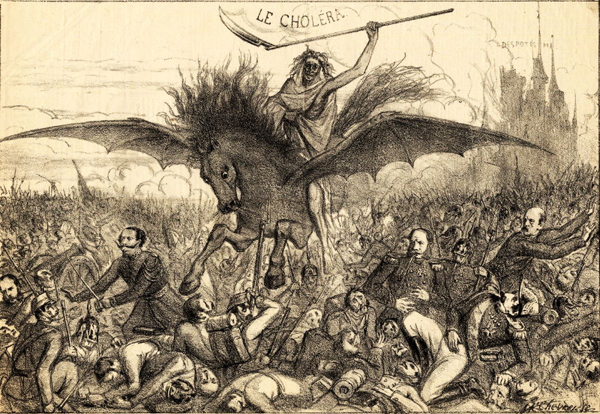
Image 1. Cholera as apocalyptic horseman (drawing in L'espiègle: journal satirique, politique, artistique et littéraire, Brussel, 1866)
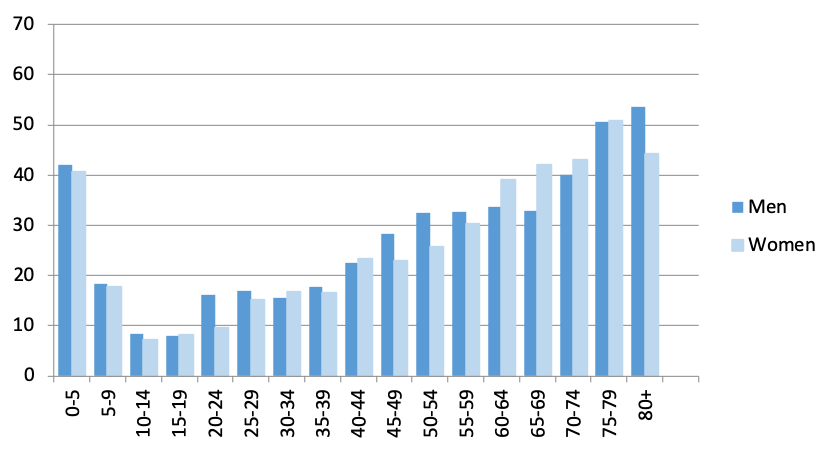
Figure 3. Age-specific mortality rates for cholera, Brussels, 1866.
Source: UGENT LOKSTAT database; 1866 census; Archives of the City of Brussel, Police, red series 83-86.

Age and gender

Like the current COVID epidemic, the effects of the cholera epidemic of 1866 were strongly dependent on age and gender. 

The disease claimed many victims in the age groups 0 to 10 years and 20 to 49 years. However, the number of victims in a certain group can also be higher simply because more people belong to that age category. 

When we take into account the age structure (the number of inhabitants per age group) made available through the LOKSTAT database, a specific pattern emerges (figure 3). 

For example, it appears that the greatest mortality risks occurred in the first years of life and in later life (60+). The lowest risk was for teenagers. Men appeared to be the most vulnerable, except in the older age groups (60-79-year-olds).


Social class

What is more difficult to determine is whether the effects of the epidemic were also strongly dependent on social class. The occupation of the deceased was mentioned on the death certificate, but this was obviously not the case for children and usually not for elderly people or women either. A good alternative to measure the wealth of the deceased is the cadastral income of the residence of the deceased (the so-called rental value). By linking the home address of the deceased to the POPPKAD database, we were able to trace the cadastral income of the cholera victims in Brussels, as we have the rental value of every house in Brussels for the years 1864-66. The data can be displayed in a historical geographic information system which was set up in the context of the POPPKAD project. This means we can closely follow the course of the cholera epidemic, day after day, since the deadly outbreak in Brussels on 26 May 1866.

As stated, the outbreak started in a working-class neighbourhood at the Vieux Marché. It spread fairly quickly to the immediate surroundings, the south and southwest of Brussels. The working-class areas in the north and around the Chaussée d’Etterbeek in the very eastern part of the city followed in mid-June. In July we also see the disease becoming more prevalent in neighbourhoods with a higher average cadastral income. In fact, it is striking that the epidemic claimed victims in all sections of the population, but that in the more affluent neighbourhoods it took several weeks before the disease hit hard. Of course, we should also take into account that the citizens in houses with a high cadastral income were not all necessarily well-off. After all, many large houses were divided into smaller dwellings and rented out.

Moreover, in order to determine the specific spatial distribution of cholera, it is also important to take into account the composition and density of the population in the different streets and neighbourhoods. Unfortunately, the historical sources do not allow us to go down to that level of detail, but we do have the number of inhabitants per street. This means we can better examine the extent to which different neighbourhoods were affected.

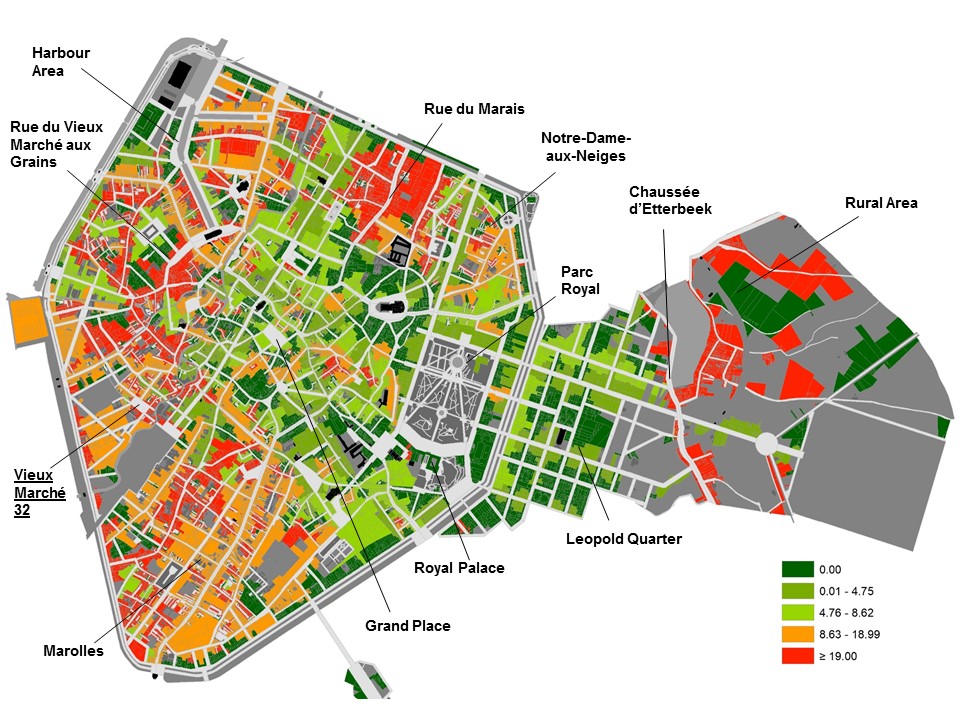
For example, we can say that the cholera epidemic manifested itself very selectively in spatial terms. Figure 4 shows that cholera wreaked havoc (red and orange areas) in the lower-lying working-class neighbourhoods in the south (Marolles), southwest (Vieux Marché) and north (harbour area and Notre-Dame-aux-Neiges) of the city. 

In addition, there were many deaths in the rural area to the east of the Chaussée d’Etterbeek, where likewise numerous workers were housed in small dwellings. Most of the higher-lying neighbourhoods, on the other hand, were relatively mildly affected (green areas). This is true of the commercial districts in the city centre, the residential areas around the Royal Park and the Leopold Quarter with its numerous embassies and consulates.

Figure 4. Crude cholera mortality rates per street (number of deaths per 1000 inhabitants), Brussels, 1866.
Source: UGent POPPKAD database; E. Janssens, La mortalité dans la ville de Bruxelles, Bruxelles, 1868.

Now that we know who the main victims of the cholera epidemic were, it is also important to gain a good insight into its causes. Access to clean drinking water played a central role here. Incidentally, in 1858 Brussels became the first Belgian city to have a public water supply. The city council tried to get as many people as possible to connect to the network. To that end, a number of fountains and public water pumps were even closed or removed, much to the dismay of a large section of the (poor) Brussels residents who saw this move as robbing them of their only source of water. The question is therefore whether or not the stance of the Brussels city council made the cholera epidemic of 1866 worse, but more on this in a future blog …


If you want to use one of the datasets above, do not hesitate to contact queteletcenter@ugent.be. 

Or would you like to lend a hand to our new citizen science project www.sosantwerpen.be in which we, together with volunteers, will study the social inequalities in causes-of-death in the city of Antwerp (1820-1946)? 

Do you want to know who were the victims of the cholera epidemic in Antwerp? Then register via sosantwerpen@ugent.be!

Sources

  • Stadsarchief Brussel, politiearchief, dossiers cholera 1866.
  • UGent Queteletcenter, HISSTER database 1866.
  • UGent Queteletcenter, GIS Brussels 1865.
  • UGent Queteletcenter, LOKSTAT database 1866.
  • UGent Queteletcenter, POPPKAD database Brussels 1865.

Literature

  • Département de l’Intérieur. Documents statistiques de la Belgique, 1868.
  • Janssens, Eugène. Recherches statistiques sur la a mortalité dans la ville de Bruxelles, Bruxelles, 1868. 
  • Falise, Claudine. “Le cholera à Bruxelles en 1866”, Annales de la Société belge d’histoire des hôpitaux, 17(1979): 81-104. 
  • Viré, Louis. La distribution publique d’eau à Bruxelles, Bruxelles, 1973.

Welcome to Antwerp ?

DETAILS

Used database:

LOKSTAT

Date:

March 2021

Category:

Scientific publication

Welcome to Antwerp? The immigration policy in Antwerp, 1830-1880

In the nineteenth century, the immigration policy underwent major changes. Journalist and historian Ellen Debackere studied the policy in the city of Antwerp from 1830 to 1880. She shows how the priorities of the local policy differed from those of the national state. The city applied the general policy towards foreign newcomers selectively. The studies carried out so far on the history of Belgian migration policy in the nineteenth century have been mainly limited to the national level with an emphasis on legislation. The implementation of the regulations in a political system characterized by a strong municipal autonomy have so far been little studied. Ellen Debackere’s research fills this gap. It was carried out as part of a doctoral thesis (UA-VUB) and is based in part on census data from LOKSTAT.


Book:

Ellen Debackere, Welkom in Antwerpen? Het Antwerpse vreemdelingenbeleid, 1830-1880. Leuven: Universitaire Pers, 2020, 1-280.

Like mother, like daughter ?

DETAILS

Used database:

LOKSTAT

Date:

April 2021

Category:

Scientific publication

Like mother, like daughter ?

For a long time, research into the practice of professions has been limited to sons, despite the great importance of female employment in the past. Vincent Delabastita and Erik Buyst (Department of Economics KULeuven) used marriage certificates in nineteenth-century West Flanders to investigate not only the economic activities of fathers and sons, but also those of mothers and daughters. To what extent did these children exercise the same profession of the parents? Analysis of numerous marriage certificates show that daughters were more mobile than sons. However, daughters saw less growth in intergenerational mobility during the province’s gradual industrialization. The researchers used LOKSTAT to map the general population trend. 


Article:

Vincent Delabastita en Erik Buyst . “Intergenerational mobility of sons and daughters: evidence from nineteenth-century West Flanders”, in European Review of Economic History, 2021, 1-28.


More than 600 volunteers at work!

DETAILS

Used database:

/

Date:

26 February 2021

Category:

Citizen science project

More than 600 volunteers at work!

At the end of October 2020, the Quetelet Center launched the citizen science project S.O.S. Antwerp (Social Inequalities at Death (1820-1946). What did the people of Antwerp die of?). In this project, the data of the unique handwritten cause-of-death register of the city of Antwerp are entered into a digital database by volunteers working at home. 

In that register, the cause of death of each person deceased between 1820 and 1946 is mentioned, together with the date of death, age, profession, marital status and all kinds of other personal information. It contains the data of almost 500,000 people! 

By the end of February 2021, after four months, no less than 600 volunteers from Belgium and the Netherlands are involved in the project and more than half of the data has been entered twice. As such, this has become the largest historical academic crowdsourcing project in Belgium!

With S.O.S. Antwerp, the Quetelet Center will study causes of death and epidemics in the past two centuries: the differences between men and women, young and old, rich and poor, etc. The research will not only provide a good picture of public health in the past but will also have important implications for our understanding of health developments today. How did epidemics such as the Spanish Flu, the smallpox outbreak of 1870-71 and that of cholera in 1866 spread among the various population groups? When did the registration of cancers and cardiovascular diseases first start to increase, and in which groups? 

Are you looking for an instructive activity that you can do indoors? Register at www.sosantwerpen.be and find out who the victims of epidemics were! 


Belgium: the nineteenth-century anti-vaxxer?

BELGIUM: THE NINETEENTH-CENTURY ANTI-VAXXER?

DETAILS

Used database:

HISSTER

Date:

January 2021

Category:

Blogpost

Auteur: Isabelle Devos

At the end of December 2020, Belgium started the vaccination campaign against COVID-19. This is more than two centuries after the very first vaccine was administered. Back then, it concerned smallpox, the only disease for which a vaccine was developed and rolled out on a large scale in Europe as early as the nineteenth century. For other infectious diseases, this did not happen until the 1950s-60s. 

Although Belgium was one of the pioneers of smallpox vaccination, it failed to introduce compulsory vaccination against the disease in the nineteenth century, unlike almost all other European countries. It became clear that the information campaign from the start was not enough to overcome the lack of political will and suspicion among the general public in the longer term.

Variola virus 

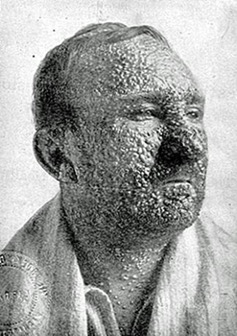
Smallpox is a highly contagious disease that is spread by the variola virus and transmitted through the air or by direct contact. The disease is easily recognized by a purulent rash and pus-filled sores. 

Until the early nineteenth century, the disease caused 5 to 15 per cent of all deaths, mainly among children. Those who survived the disease were marked for life by deep, pitted scars, but gained immunity. 

Smallpox was eradicated in 1980, the only infectious human disease to have been eliminated worldwide. This is thanks to a large-scale vaccination campaign that had already started in Europe at the beginning of the nineteenth century.


Man_met_pokken
Man with smallpox
Lady-Mary-Montagu
Lady Montagu (1689-1762)

From variolation to vaccination

The forerunner of vaccination, so-called variolation, was introduced to Europe early in the eighteenth century. This technique, which originated in China, consisted of deliberately infecting people by applying a small dose of smallpox (scabs or pus from the sores) through a cut in the arm. 

Variolation became known in Europe through, among others, Lady Mary Montagu, wife of the British ambassador in Constantinople, who had learned about it there. 

Once a victim of the disease herself, on her return to England she had her daughter inoculated in the presence of several prominent doctors. Many enlightened minds and monarchies, such as in Sweden and Russia, encouraged the use of this new medical technique.


The first variolations in our regions took place on 17 May 1768 in Brussels. The Gazette des Pays-Bas reported on it two days later. Doctors in other cities and rural municipalities soon followed. 

Various ordinances were issued under Maria Theresa and Joseph II to prevent the spread of the disease by using variolation. As of September 1768, variolations were only allowed to be administered at a distance of least 200 toises (390 metres) from a built-up area. Violations were punished with a fine of a thousand guilders. In 1788, Joseph II extended the distance to 400 toises and introduced a higher fine. 

Meanwhile, opposition to the variolations had grown all over Europe, especially from the clergy and doctors. On the one hand, it was considered interference with God’s work and, on the other, inoculating healthy people was thought to be dangerous.

Vaccination

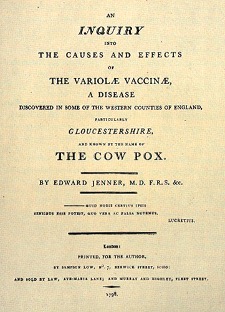
A few decades later, the British country doctor Edward Jenner came up with a new, less risky technique. In 1796, he discovered that milkmaids could get cowpox, but did not get the dangerous human smallpox. 

Cowpox was a milder form of the human variant and it made these women immune to smallpox. The inoculation of healthy people with cowpox would protect them for life, according to Jenner. 

At the beginning of 1800, the first inoculation with cowpox was administered in Ostend. The first smallpox inoculations, later called vaccination (from the Latin for cow: vacca), were initiated by a number of surgeons and medical societies. 

They tried to convince the population of the benefits through popularizing brochures and lectures. Some doctors also offered inoculations free of charge, such as Joseph Kluyskens in Ghent and Louis Vrancken in Antwerp.

Publication by Edward Jenner (1749-1823) about his research on cowpox vaccination

Promoting the cowpox inoculation was also an important pillar of the health policy of the enlightened French administration, which continued under the Dutch and Belgian regime. Local vaccination committees were set up for this purpose. 

From 1807 onwards, smallpox inoculation became a condition in various places for access to municipal education and poor relief. In 1818, this was extended to the rest of the Low Countries, including a vaccination registration. People could obtain an inoculation free of charge from a doctor. 

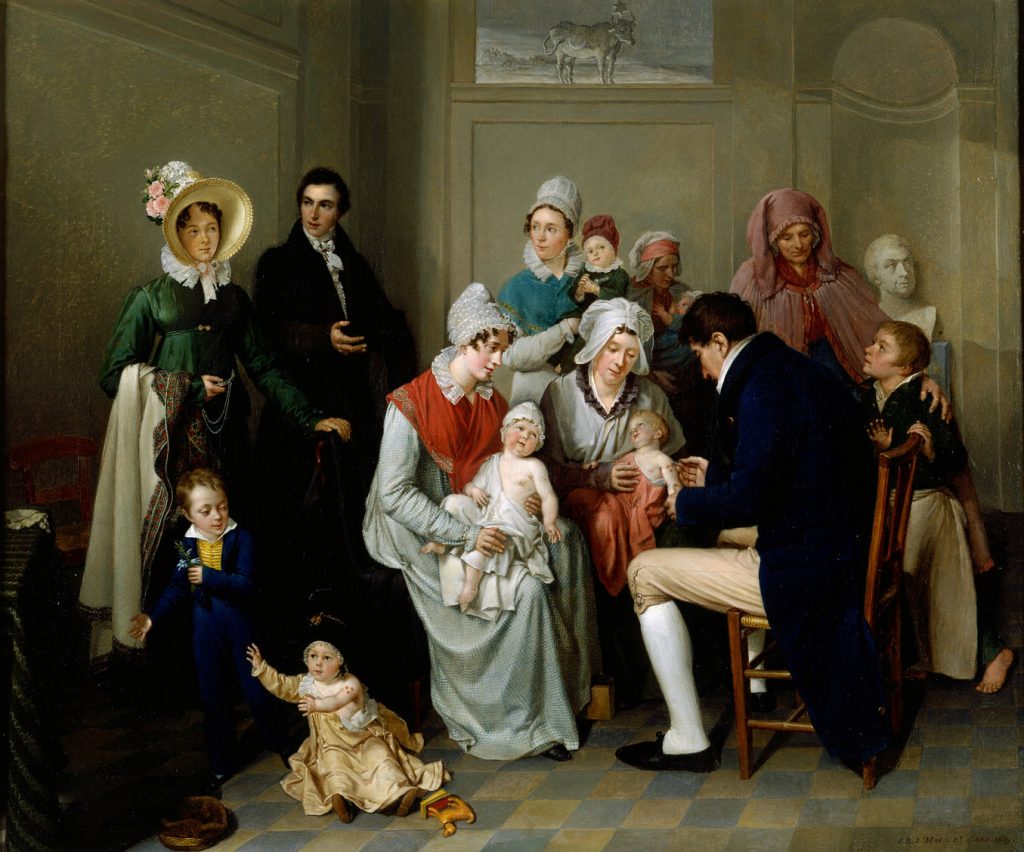
J.B. Maes, Smallpox Hall, 1819 (STAM Ghent).

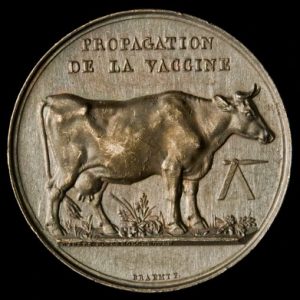
Outstanding vaccinators were awarded a medal and a small cash premium. However, as there was no compulsory school attendance at the time, a large proportion of the children were not included. Moreover, the inoculation of healthy people aroused a lot of suspicion, which was sometimes religiously motivated. 

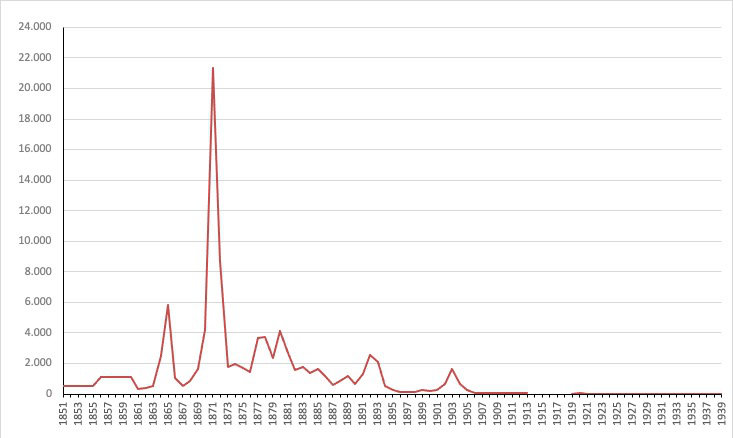
The official figures for the years 1830-60 indicate a vaccination rate among young children of 50 per cent on average, but with very large provincial and local differences. This led to new epidemics. For example, a smallpox flare-up in 1865 caused almost 6,000 deaths, and in the early 1870s the spread of the virus during the Franco-Prussian War led to 35,000 deaths. 

The Antwerp and Limburg regions were particularly hard hit at the time, as a result of the deportation of French prisoners of war who were interned in the citadel of Antwerp and the camp of Beverlo after the battle of Sedan in 1870.


Medal for the promotion of cowpox vaccination (Ghent University Library)
Graph 1. Annual number of smallpox deaths; Belgium 1851-1939 Source: UGent Quetelet Center, Hisster database.

Compulsory vaccination?

DThe introduction of compulsory vaccination in Europe took place in two phases. Bavaria and Hesse were the first in 1807, quickly followed by other Prussian states, Denmark, Sweden, and then England in the middle of the century. 

After the great smallpox epidemic in the 1870s, vaccination became compulsory in most other European countries, and finally also in Spain in 1903. Belgium, together with Austria, was the only European country where vaccination was not made mandatory. 

This exceptional situation did not go unnoticed abroad. The leading medical journal The Lancet wrote in 1889 that the anti-vaccination movement hardly needed to campaign here because “indifferentism, which is peculiarly rife in Belgium, seems to answer its purpose”. Medical experts tried to convince the general public of compulsory vaccination, but “it is very doubtful if they will get many people to listen to good advice”.


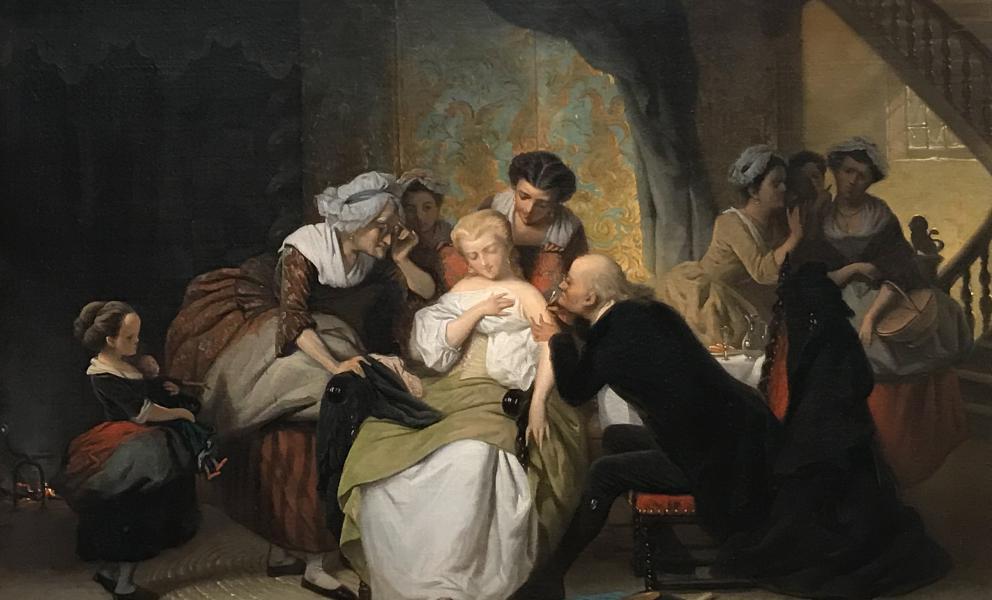
Jan Jozef de Loose (1769-1849), Vaccination (Stedelijk Museum Sint-Niklaas).

The reality had little to do with national character. Rather, the young Belgian nation did not want to impose strict rules on its inhabitants. In political circles, compulsory vaccination was seen as a major restriction on individual freedom, despite the country’s higher smallpox mortality rate. The effectiveness of the vaccine was also called into question. In the meantime, it became apparent that several doses were required to achieve lifelong immunity. 

In 1911, a draft law on compulsory vaccination was submitted to parliament, but it was not presented again until decades later due to elections, war conditions and other developments. Mandatory vaccination was eventually introduced in 1946, at a time when there were no more victims but vaccination was still necessary to prevent the return of smallpox.

If you want to use one of the dataset mentioned above, do not hesitate to contact queteletcenter@ugent.be


Or would you like to lend a hand to our new citizen science project www.sosantwerpen.be in which we will study the social inequalities in causes-of-death in the city of Antwerp (1820-1946) with the help of volunteers ?


Do you want to know who the victims of the cholera epidemic were in Antwerp? Then register via sosantwerpen@ugent.be 

Sources

  • UGent Quetelet Center, HISSTER database.
  • Draft Health Bill 1911, Chamber of Representatives, 5 December 1911. 
  • Proposed Dexters Bill, Chamber of Representatives, 7 August 1945.
  • Royal Decree on cowpox vaccination, 6 February 1946.

Literature

  • Devos, Isabelle. “De negentiende-eeuwse antivaxers”. De Standaard, 23 december 2020.
  • Gadeyne, Guy. “Maatregelen ter bevordering van de vaccinatie uitgevaardigd door het Centraal Bestuur van het Scheldedepartement (1800-1814)”. Annalen van de Geschied- en Oudheidkundige Kring van Ronse, 23 (1973): 133-171.
  • Gadeyne, Guy. “Variolatie en vaccinatie tegen de pokken in België sinds de 18de eeuw”.  Geschiedenis der Geneeskunde 6, nr. 6 (2000): 364-375.
  • S.N., “Smallpox and vaccination in Belgium”. The Lancet 133, nr. 3430 (1889): 1048

Regional industrialization in a comparative perspective

DETAILS

Used Database:

LOKSTAT

Date:

December 2020

Category:

Scientific publication

Regional industrialization in a comparative perspective

Over the past two centuries, regions in Europe and Asia have industrialized in very different ways. A recently published book highlights the similarities and differences in industrialization processes in Belgium, the Netherlands, Italy, Yugoslavia, China and Japan. Attention is paid to, among other things, the consequences of industrial policy, agglomeration forces, globalization and the determinants of industrial location over time.

The book was edited by Bas van Leeuwen (IISH), Robin Philips (IISH and history alumnus of Ghent University) and Erik Buyst (KULeuven). It contains case studies and other contributions from an international team of researchers with the participation of Ghent University (Glenn Raypp and Stijn Ronsse, Department of Economics).

The research on Belgium is based on LOKSTAT data from the industry and population censuses, as well as contextual data on the development of the traffic infrastructure.

Book:

Van Leeuwen, Bas, Robin Philips and Erik Buyst eds. An Economic History of Regional Industrialization. New York/London: Routledge, 2020.

Abstract:

This book offers a comprehensive study of regional industrialization in Europe and Asia from the early nineteenth century to the present. Using case studies on regional industrialization, the book provides insights into similarities and differences in industrialization processes between European, Eurasian and Asian countries. Important factors include the transition from traditional to modern industrial production, industrial policy, agglomeration forces, market integration, and the determinants of industrial location over time. The book is an invaluable reference that attempts to bridge the fields of economic history, political history, economic geography, and economics while contributing to the debates on economic divergence between Europe and Asia as well as on the role of economic integration and globalization.

The rise of industrial Belgium

DETAILS

Used database:

LOKSTAT

Date:

OCTOBER 2020

Category:

Doctoral research

The rise of industrial Belgium

Which factors were decisive for the breakthrough of industry in the 19th century? Franz Xaver Zobl investigated industrial development in France and Belgium in search of these determining factors. As part of his PhD at the London School of Economics (LSE), he studied the importance of access to coal and markets to explain regional patterns of Belgian industrialization. His analysis shows that both access to coal and markets played a crucial role. In general, more attention must be paid to supply and demand to explain industrialization processes. Zobl based his statistical analysis on the extensive industry census of 1896 made available by Lokstat.  Recently, the doctoral dissertation from 2018 has become freely available to interested readers in full and without restrictions (see below).

PhD thesis:

Zobl Franz Xaver. Regional Economic Development under Trade: Liberalisation, Technological Change and Market Access: Evidence from 19th century France and Belgium. PhD thesis, London School of Economics (LSE), 2018.

Real estate at the service of economic development

DETAILS

Used Database:

LOKSTAT & POPPKAD

Date:

NOVEMBER 2020

Category:

Scientific publication

Real estate at the service of economic development

Nicolas de Vijlder (Department of History UGent) and Koen Schoors (Department of Economics UGent and Higher School of Economics, National Research University Moscow) investigated the factors that have led to the industrialization and economic development of Flanders. They analyzed the development of the economy in most Flemish localities in the period 1830-1910. They explain the regional differences that their analysis reveals with the help of Hernando de Soto’s thesis, which identifies a well-ordered property system as an essential condition for economic development. In regions where real estate generated significant income and was used as collateral for loans, the local economy grew through investment in trade and industry. This pattern is in line with de Soto’s predictions.

The research is based on an extensive analysis of land prices and data on real estate, employment, industry and trade in 1,179 municipalities from LOKSTAT and POPPKAD.


Article:

De Vijlder, Nicolas and Koen Schoors. “Land rights, local financial development and industrial activity: evidence from Flanders (nineteenth–early twentieth century)”.  Cliometrica, 14(2020), 3: 507-50.


Abstract:

In this paper, we investigate the hypothesis that the economic divergence across Flemish localities between 1830 and 1910 is explained by the theory of Hernando de Soto. We hypothesize that the uniform land rights installed after the French revolution provided borrowers with an attractive form of collateral. Conditional on the presence of local financial development provided by a new government-owned bank this eased access to external finance and fostered industrial and commercial economic activity. Using primary historical data of about 1179 localities in Flanders, we find that the variation in the local value of land (collateral) and the variation in local financial development jointly explain a substantial amount of the variation in non-agricultural employment accumulated between 1830 and 1910. By 1910, industrial and commercial economic activity was more developed in localities where both early (1846) rural land prices were high and early (1880) local financial development was more pronounced, which is in line with the ‘de Soto’ hypothesis.

Viruses know no borders, unfortunately vaccines do

VIRUSES KNOW NO BORDERS, UNFORTUNATELY VACCINES DO

DETAILS

Used databases:

HISSTER

Date:

May 2021

Category:

Blogpost

Author: Isabelle Devos

The vaccination campaign against Covid-19 in Belgium is in full swing, but things are not going smoothly everywhere. There are big differences between municipalities. In Flanders, the coastal municipalities of Knokke-Heist and Koksijde are the frontrunners, with around 60 per cent of its people vaccinated; Vilvoorde, with barely 30 per cent vaccinated, lags far behind (31 May 2021). According to some, the vaccination rate can be considered a poverty indicator: vaccination coverage in the poorest municipalities is significantly lower than elsewhere. 


During the first vaccination campaign, some two centuries ago, there was also a clear link with poverty. Then it was smallpox. But the relationship was just the opposite: at that time, the poorest regions had the highest vaccination rates.

Covid-19 vaccination: large local differences

The differences in vaccination coverage are, on the one hand, related to age distribution (some municipalities have a much older population) and logistical arrangements regarding the delivery of vaccines and how people are contacted (letter, email, etc.).

On the other hand, not everyone is equally willing to have an injection. In particular, Brussels and the French-speaking part of the country have a higher proportion of people refusing the vaccine. Some say this has to do with the strong influence of the French media, where vaccination scepticism is widespread (due to several medical scandals, among other things). Religious motives or a lifestyle that is very closely bound to nature are also reasons for refusing the vaccine. Others point to a connection with socio-economic status, in particular the level of education and/or migration background. People with low educational attainment usually have less confidence in (medical) science. Also, the ability to understand information about the vaccine in a language that is not your mother tongue can have a major impact on a person's willingness to be vaccinated.​

The very first vaccination campaign

Vaccination has been around for over 200 years. In 1796, the English country doctor Edward Jenner demonstrated the link between cowpox and smallpox when he discovered that infecting people with cowpox made them immune to smallpox. 

In the early modern period, one in ten people died from the disease; children were particularly affected. Jenner’s invention spread quickly. In Belgium, the Ostend physician Roselt carried out the first cowpox inoculation in 1800, followed by the surgeon Demanet in Ghent and other doctors in other parts of the country.

Cowpox inoculation was one of the showpieces of the French enlightened administration. It tried to convince the population of its usefulness through information committees and popularising brochures, but with little success. From 1809 onwards, they used gentle coercion. 

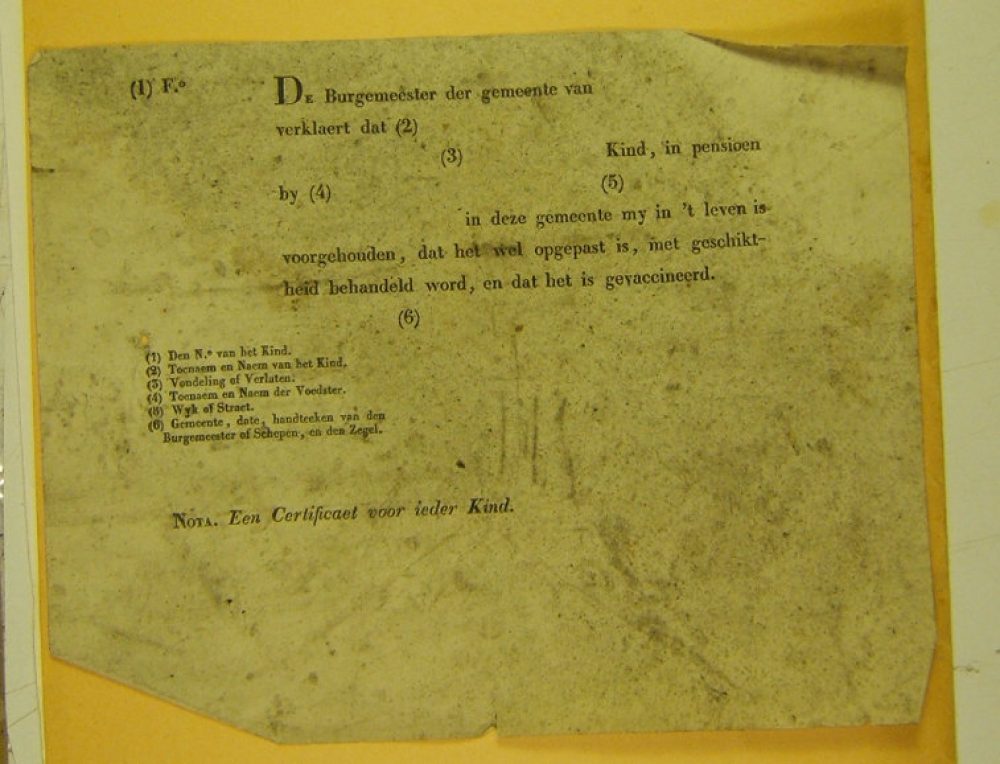
Access to education and poor relief could now only be accessed with a vaccination certificate. Children could not attend school without a so-called ‘smallpox note’. Families who applied for poor relief received no support if their children had not been vaccinated. 

The crusade against smallpox was continued with the same zeal under the United Kingdom of the Netherlands. This was enshrined in the Royal Decree of 1818, but it was not until ca. 1823 that it was implemented on a large scale. After that, vaccination figures rose rapidly. By the end of the 1820s, an average of two-thirds of all children in the United Netherlands had been vaccinated.
Vaccinatiebewijsklein
Vaccination certificate (Ghent State Archives, Hollands Fonds, Box 8a (Gadeyne Collection))

Geographical patterns in vaccination coverage

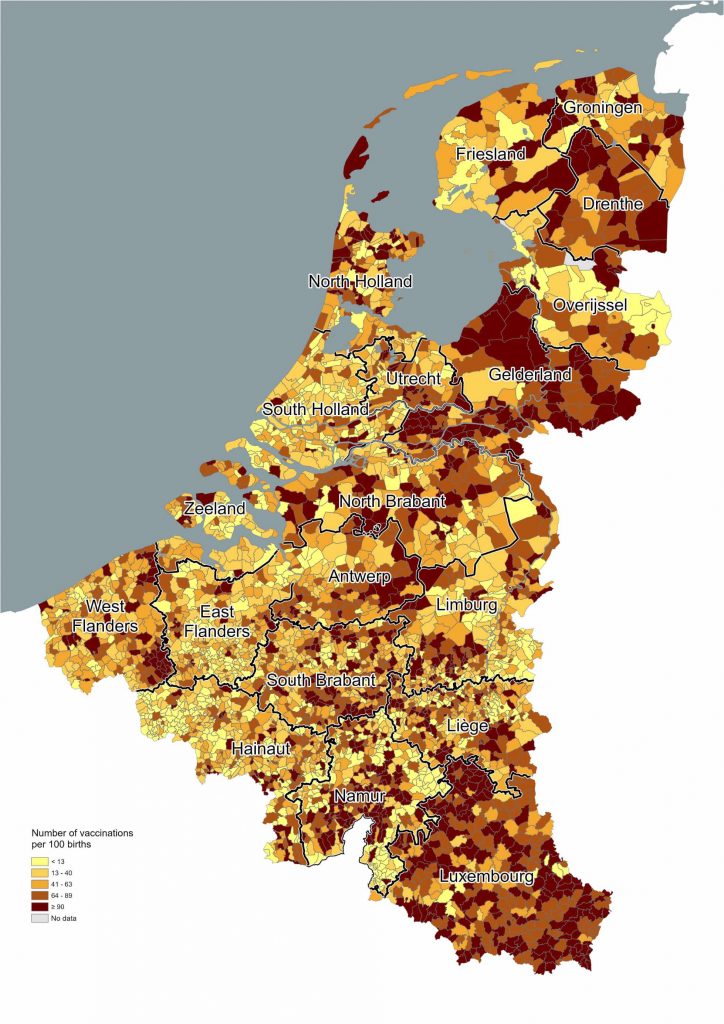
This national average, however, hides large regional and local differences. The Quetelet Center has been able to reconstruct municipal vaccination maps for the years 1827-29, based on the annual ‘status of cowpox inoculation’. Although it is a snapshot and the vaccination registration had some flaws, the maps give a clear picture of the geographical patterns in vaccination. 

We calculated vaccination coverage in relation to the number of births rather than the population, because smallpox was a childhood disease and vaccinations were mainly administered to children.

In many municipalities, vaccination coverage was low: less than 13 per cent of children were vaccinated (see map 1). High rates are observed in the regions around Kortrijk, Bruges, Turnhout, Wavre, Dinant, Philippeville and Luxembourg. In the north, Drenthe, Gelderland and parts of Friesland and North Brabant stand out with above-average figures. In some municipalities, 90 per cent or more were vaccinated.

Map 1. Number of smallpox vaccinations per 100 births, the Netherlands, 1827-29

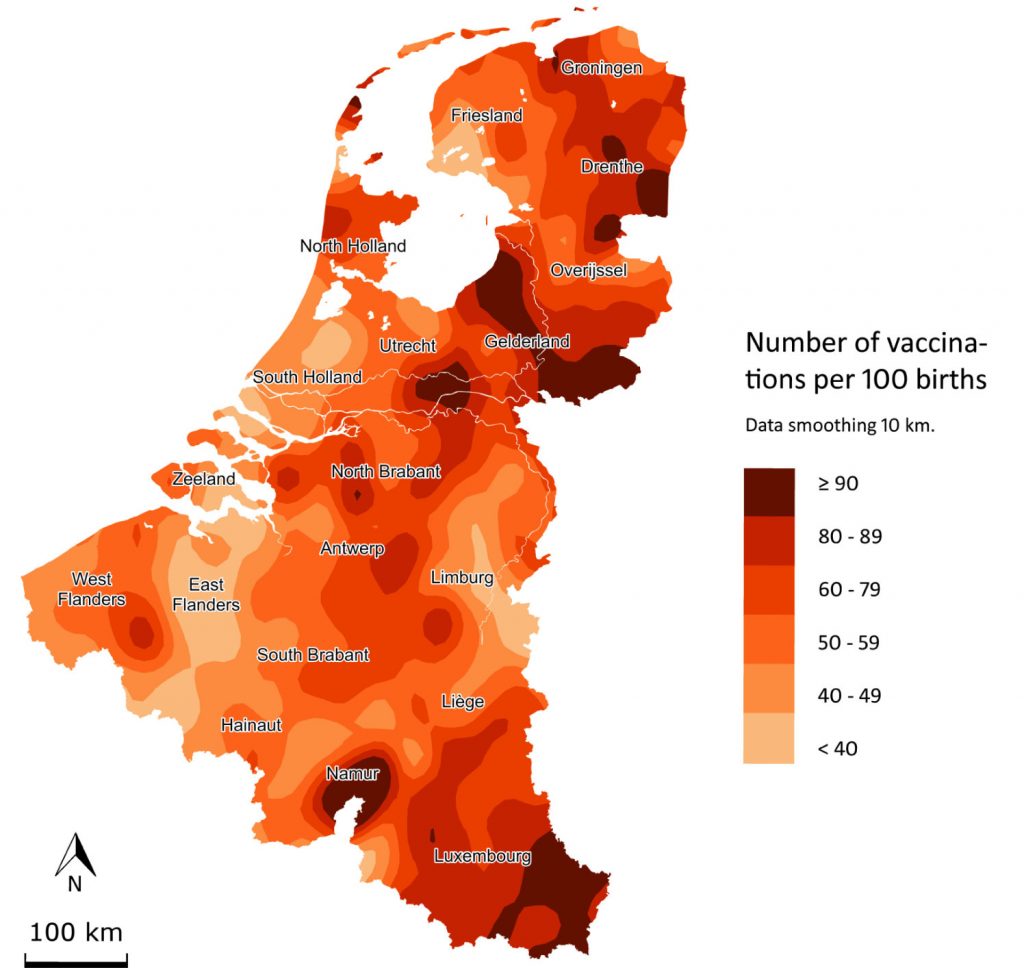
Using smoothing techniques, we can smooth out local differences and make the geographical patterns even more visible (see map 2). The regional vaccination maps clearly show that the vaccination campaigns were most successful in the northeast and the southernmost part of the United Netherlands. This is remarkable, because these were the most sparsely populated rural areas of the kingdom and the risk of infection was lower there. That they were also the poorest regions is less surprising, given the vaccination legislation. But there is more.

Map 2. Number of smallpox vaccinations per 100 births (after smoothing 10 km.), the Netherlands, 1827-29

Not an unqualified success

The map is not only the result of a series of socio-economic factors (percentage of poor people and schoolchildren in the population), but also of a mishmash of provincial and local regulations. The implementation of the central vaccination policy was in the hands of the provincial and local governments. They had great autonomy. Since there was no compulsory education at the time, a large number of children were missed. According to the Dutch historian Willibrord Rutten, the province of Drenthe was ahead of its time in this respect: it linked compulsory vaccination to general compulsory primary school education. Gelderland and Luxembourg, which like Drenthe were among the most literate regions in the United Netherlands, also kept a strict check on compulsory vaccination. By contrast, enforcement in the west of the country was less strict: many municipal schools admitted children without a smallpox note.

Vaccination scepticism

Just as not every individual was convinced of the benefits of the vaccine, this was also the case for the local authorities. There was a great deal of fear around vaccination. After all, it was not clear how the vaccine worked. Viruses and other pathogens were unknown until the late 19th century. 

The fact that healthy children were being inoculated with a cow disease also aroused a lot of suspicion. There were also dissenting voices from Catholic quarters, despite the fact that Pope Pius VII had approved the vaccination campaign. For many Catholics, smallpox and other diseases were a punishment from God. Vaccination was therefore not permitted, as it could undermine God’s work. 

Nevertheless, the well-known cultural fault line between Catholics and Protestants, below and above the Moerdijk, is not visible on our vaccination maps.

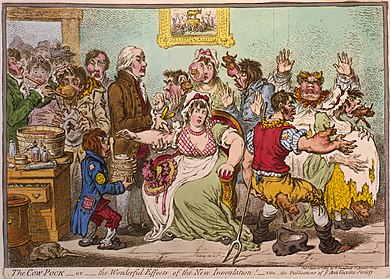
J. Gilray, The Cow-Pock—or—the Wonderful Effects of the New Inoculation!

Anti-Vaccine Society Print, 1802

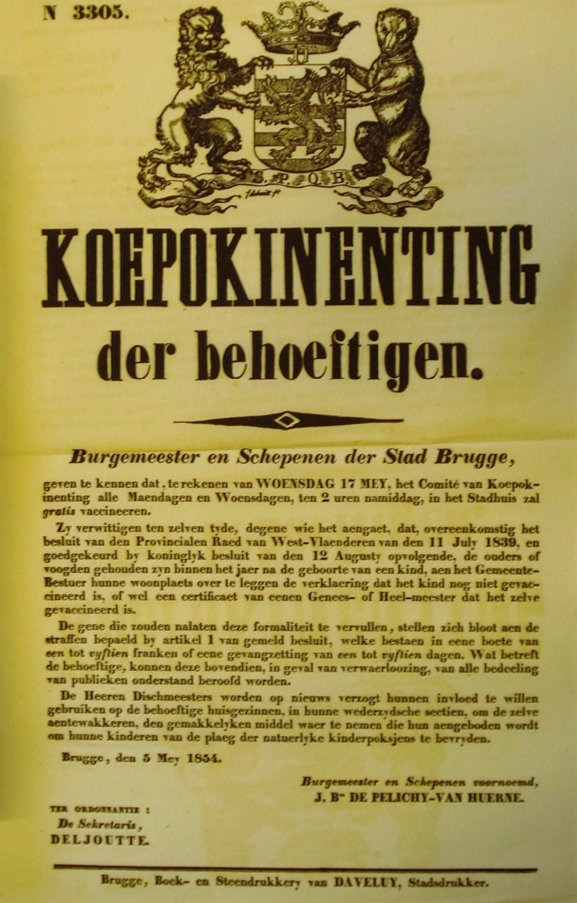
Smallpox vaccination poster, 1854 (OCMW-archives Bruges. Bureel van Weldadigheid. Geneeskundige dienst. Box 191, file 292).

High vaccination coverage in the poorest, most sparsely populated and most illiterate regions

Moreover, not every local authority had sufficient means to pay for such a campaign, even though local doctors and surgeons were supplied with cowpox material by the provincial medical commissions. 

Children were vaccinated free of charge, but in many regions the physicians received a small fee for the work from the municipal coffers. In addition, gold and silver medals were awarded to those physicians who had performed the largest number of free vaccinations. Indeed, many waited until they could vaccinate a sufficient number of children to be entitled to a medal.

Due to the differences in the enforcement of the compulsory vaccination of schoolchildren and poor children, a paradoxical situation arose in which the highest vaccination rates occurred in the poorest, most sparsely populated and most literate areas of the United Netherlands. Belgium had to wait until 1946 for general compulsory vaccination. Belgium and Austria were the only European countries that did not introduce compulsory vaccination in the 19th century. Read here why.

Disaster planning

The first vaccination campaign against smallpox highlights some fundamental challenges for policymakers that still apply today. It shows that it is not possible to have an effective vaccination policy without taking into account socio-economic and regional differences. In several respects, the difficulties in the current vaccination campaign can be compared with those of 200 years ago. 

As early as 2017, the Norwegian demographer Sven-Erik Mamelund pointed out the limited attention given to social inequality in the disaster planning of international organisations such as the World Health Organization. While such disaster planning did take into account the special situation of low-income regions during epidemic outbreaks, it did not take into account the internal disparities in those countries or in high-income countries. 

Yet, as we now know, regional and social inequality in health prevention can significantly delay the fight against an epidemic. In the Belgian vaccination campaign against Covid-19, certain groups are vaccinated as a priority. These are primarily people who are at higher risk because of their age or medical history. By having policy strategies and projection models that take better account of socio-economic and cultural differences in the willingness to be vaccinated and adherence to behavioural measures, epidemics could undoubtedly be better combatted in the future.

Sources

  • National Archives The Hague, Archief van het Ministerie van Binnenlandse Zaken, Afdeling Algemene Zaken,  1823-1831, toegang 2.04.01, nrs. 821-841.
  • Agentschap Zorg en Gezondheid, Vaccinatieteller, https://www.laatjevaccineren.be/vaccinatieteller-cijfers-per-gemeente (laatst geraadpleegd 31 maart 2021) 
  • UGent Queteletcenter, HISSTER database

Literature

  • Boonstra, Onno. Regionale verschillen in het analfabetisme in Nederland. 1775-1900, Working paper of the Scientific Research Community Historical Demography, WOG/HD/2009-11.
  • Devos, Isabelle. “De negentiende-eeuwse antivaxers”. De Standaard, 23 december 2020.
  • Gadeyne, Guy. “Maatregelen ter bevordering van de vaccinatie uitgevaardigd door het Centraal Bestuur van het Scheldedepartement (1800-1814)”. Annalen van de Geschied- en Oudheidkundige Kring van Ronse, 23 (1973): 133-171.
  • Gadeyne, Guy. “Variolatie en vaccinatie tegen de pokken in België sinds de 18de eeuw”.  Geschiedenis der Geneeskunde 6, nr. 6 (2000): 364-375.
  • Rutten, Willibrord, ‘De vreselijkste aller harpijen’. Pokkenepidemieën en pokkenbestrijdingen in Nederland in de achttiende en negentiende eeuw: een sociaal-historische en historisch-demografische studie, Wageningen, 1997.