- Home
- S.O.S. ANTWERP
- Deadly heat
Deadly heat
DETAILS
Used dataset
Date:
Category:
Author: Wouter Ronsijn
The summer of 2022 was hot and dry, with a heat wave from 9 to 16 August. Once again, the heat wave resulted in additional deaths. Was this also the case in the past?
We compared data from the database of S.O.S. Antwerp with temperature data collected by Belgium’s main weather station in Uccle for the period 1833-1946 and established that although the mortality during heat waves was also higher in the past, heat waves only occurred sporadically.
The summer of 1911 was exceptionally hot and led to about 200 additional deaths in Antwerp alone. These were mainly young children, who died with symptoms of stomach flu.
Health risk of extreme heat
We have had another hot, dry summer. A heat wave swept across the country from 9 to 16 August. For many people, the extreme heat poses a major health risk. The elderly and people with cardiovascular or respiratory problems in particular run a greater risk of death. During the heat wave, 343 more people died in Belgium than we would normally expect at this time of year. That is a lot, but far fewer than during the heat wave of August 2020, the first corona year, when there were no fewer than 1,460 more deaths than expected.
Did heat in the past also cause more deaths? We got to work with the provisional figures for the daily number of deaths in Antwerp, collected by the volunteers of S.O.S. Antwerp. The database of S.O.S. Antwerp contains individual data on everyone who died in the city between 1820 and 1946, including gender, age, marital status and also the cause of death of the deceased. The database allows one to determine the number of deaths per day. By comparing these figures with the daily temperatures recorded in Uccle from 1833 to 1946, we can investigate the link between heat waves and deaths.
Mortality during historical heat waves
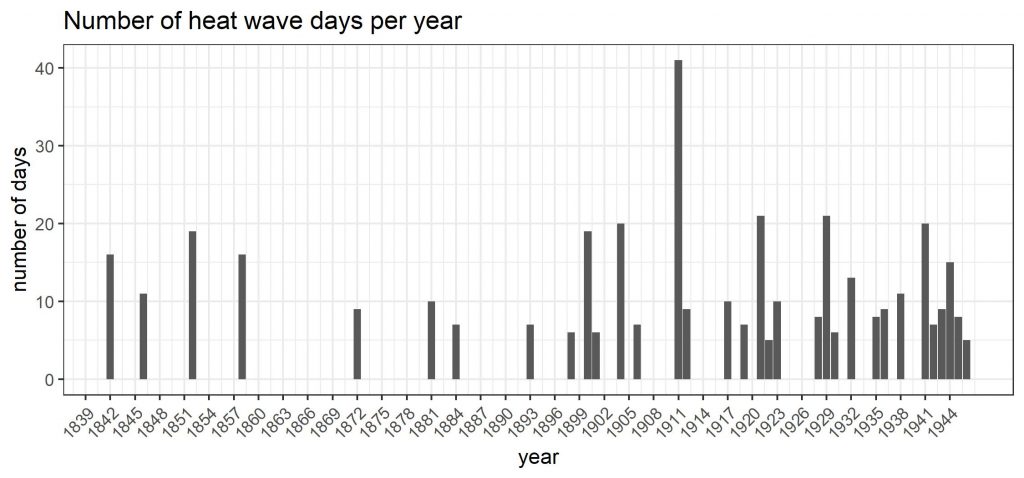
For each day, we calculated the expected mortality based on the average over the same period in the five previous and five subsequent years. We then compared the expected mortality with the actual mortality. If the actual mortality is higher than the expected mortality, we speak of ‘excess mortality’. To determine the impact of heat, we looked at excess mortality on days that were part of a heat wave. Heat wave days are the days in a period of at least five consecutive days reaching 25 °C or more, with at least three of these days attaining 30 °C or more (graph 1.).
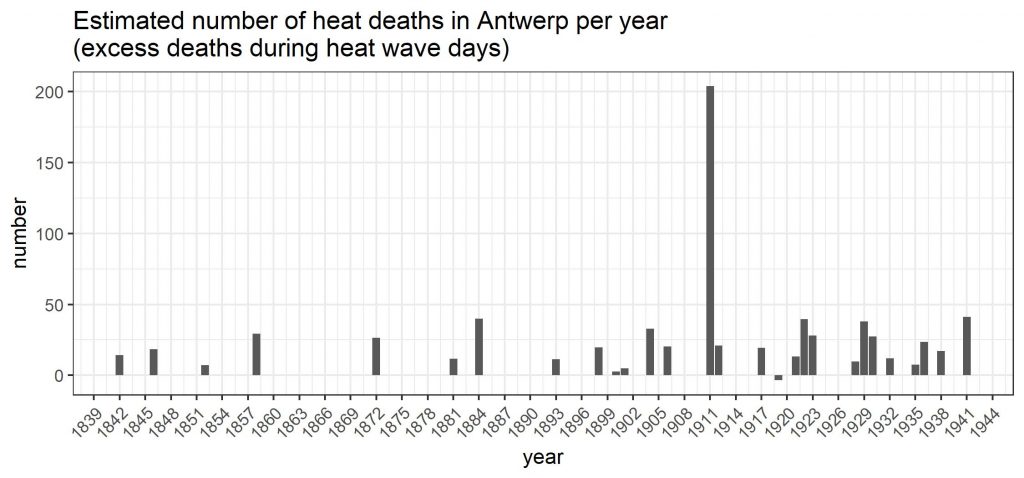
We established that heat waves in the past did indeed lead to excess deaths. On heat wave days from June to September, the daily mortality in Antwerp between 1833 and 1946 was no less than 15 to 20 per cent higher than expected. However, the impact of heat waves differed greatly from year to year. Some heat waves resulted in few additional deaths, others in many more (graph 2.).
Much depended on the intensity of the heat (how hot it got during the day as well as how much it cooled off at night) and the duration of the heat wave. If we look at an estimate of the number of heat deaths during heat waves per year, we see that the impact was usually relatively limited. As graph 2 shows, the number of heat deaths in Antwerp was rarely more than 20 or 30 per year in the years with a heat wave. There is one notable exception: the year 1911, with no fewer than 204 heat deaths (44 per cent more deaths on heat wave days). We also see that heat waves occurred more frequently in the twentieth century than in the nineteenth century (graph 1.)
These results are provisional, as the method used can be further refined. We only looked at deaths on heat wave days (i.e. days that formed part of a series of warm days), and so did not take into account deaths on individual days with high temperatures. In addition, we only looked at deaths on those days themselves, while heat could also have had an effect on the number of deaths one or two days later, when it was cooler again.
Finally, we worked with the original, uncorrected temperature observations from the Belgian Royal Meteorological Office. The temperature was measured in open cabinets until 1983, and only afterwards in closed cabinets. Adjusting the temperature observations to correspond with observations in closed cabinets would mean adjusting the summer temperatures downwards. As a result, we would find fewer heat waves than we do now with the uncorrected data.
The deadly summer of 1911
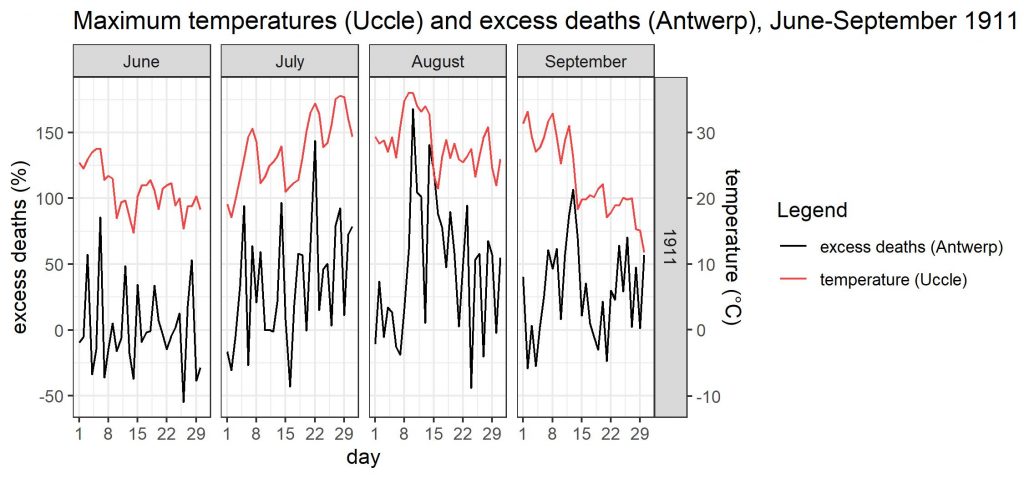
So the year 1911 had an exceptionally deadly summer. What was happening then? It was unusually hot that year. From 1 July to 30 September, a maximum temperature of 25 °C or more was recorded in Uccle on 59 days, with maximum temperatures above 30 °C noted for 24 of those days! (graph 3.)
During those months, the Antwerp newspapers Het Handelsblad and Gazet van Antwerpen regularly reported on the problems the heat was causing, in Antwerp and beyond. At the end of July, there were still upbeat stories about the heat leading to a general exodus to the sea. But soon there were also reports about Antwerp residents who, hit by sunstroke, were taken to hospital.
The police officers on horseback in particular appeared to have had a hard time. One can read in the Gazet van Antwerpen of 11 August that their horses wore straw hats for protection against the sun, but that they themselves succumbed under their heavy helmets. Not only would these “lethal lids” make the officers lose their hair in the heat, but also threaten their health.
Many of the reports sadly sound familiar. The drought that accompanied the heat led to forest fires, such as in Marche-les-Dames, or reduced crops to ashes, while a factory in Wetteren had to close temporarily due to lack of water.
Elsewhere, several factories in the country halted work for part of the day as workers became ill from the heat. In Antwerp, the heat and drought caused several fires, including a very large fire in the warehouses of the Compagnie des Magasins Généraux et Entrepots libres d’Anvers.
In Brussels, people were kept awake not only by the heat but also by an infestation of fleas. Looking for ways to cool down, many slept in the open air, in the Bois de la Cambre, the park of Koekelberg or the Warande of Sint-Gillis. According to Het Handelsblad, at night these places turned into vast camps.

(© Postcard from IBA, public domain)
In the course of August, it became clear that the heat was taking its toll mainly on the youngest. This was first apparent from figures from Paris and then from London, and on 24 August Het Handelsblad reported that this was also the case in Antwerp. The newspaper linked the high child mortality to the quality of milk. The heat and drought, and the resulting lack of animal feed, had made milk scarce and expensive.
Research by the demographer Godelieve Stroobant confirms that the heat of 1911 took a heavy toll, and that young children were the main victims. She estimates that in 1911 there were about 9,000 more deaths in Belgium than expected and the majority of them, more than 6,000, were young children. Many of them died with symptoms of stomach flu (gastroenteritis), partly due to the lack of milk and water caused by the heat and drought. Her sources also reported that during the summer of 1911, a large number of children died of gastroenteritis in and around Antwerp.
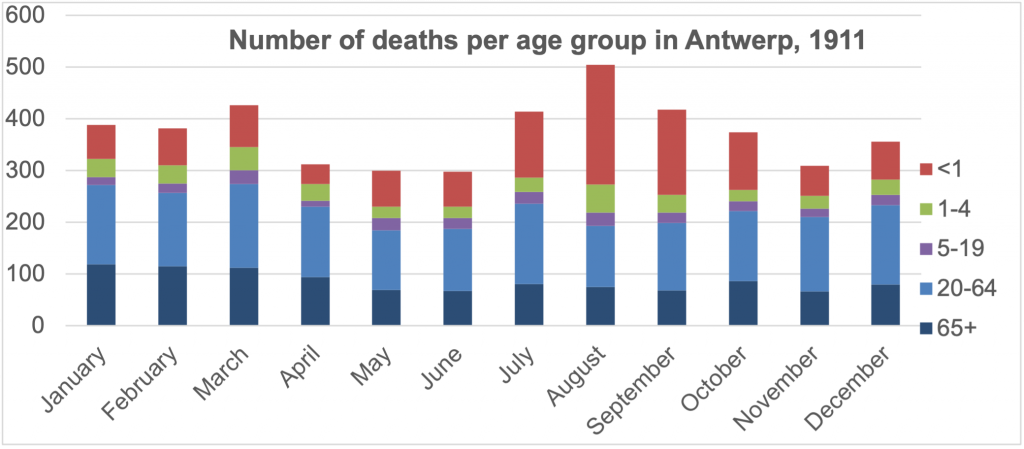
Figures from S.O.S. Antwerp support this claim. From January to June 1911, an average of 65 babies (younger than 1 year) died every month in Antwerp. During the summer months that number rose sharply, to 232 in August (graph 4.). In more than half the cases in August, intestinal complaints were noted as the cause of death, in particular stomach and intestinal inflammation or gastroenteritis. Thanks to the Antwerp data, researchers can now examine in detail to what extent the mortality during the summer of 1911 differs from that of other summers.
Nevertheless, Stroobant found that rural areas were most vulnerable during that summer. Mortality was highest in the province of Limburg, where the highest temperatures were also recorded. Indeed, the drought caused the most problems in rural municipalities. At that time, large cities such as Antwerp already had water pipes. However, the quality of the mains water in Antwerp also suffered during the drought, and the local government advised residents not to use it without first boiling it.
Different victims during historical and contemporary heatwaves?
The heat of 1911 caused exceptionally high casualties. Little is currently known about other historical heat waves, but the Antwerp data may change that. Thanks to the work of the many volunteers, we can now find out not only who was vulnerable during heat waves, but also what people died of. If this shows that, as in 1911, young children were the most vulnerable, due to the combination of gastroenteritis and heat, then historical and contemporary heat waves resulted in very different victims. Indeed, today it is not young children but the elderly who are most at risk from heat. It is possible that many elderly people were also victims of heat waves in the past, but their share in the population was too small to have a major impact on the overall mortality rate.
It is anticipated that peaks in heat-related mortality will become even more frequent in the future, due to ageing, urbanisation and global warming. The latter is the main difference between historical and contemporary heat waves. Even though historical heat waves caused many causalities, the heat waves themselves were a relatively rare phenomenon. The experience of the past few summers shows us that this is no longer the case.
Sources
- “Bescherming der policie” [“Protection of the police”], Gazet van Antwerpen, 11 August 1911, p. 2
- “Brussel – Slachtoffers van de Hitte”[“Brussels – Victims of the Heat”], Gazet van Antwerpen, 24 July 1911, p. 4.
- “Dagelijkse temperaturen te Ukkel sinds 1833” [“Daily temperatures at Ukkel since 1833”], Ransberg Weather Station website (https://www.weerstationransberg.be/Dagelijksetemperaturensinds1833.xlsx)
- “De Branden” [“The Fires”], Gazet van Antwerpen, 14/15 August 1911, p. 1.
- “De duurte der boter” [“The high cost of butter”] , Handelsblad, 26 August 1911, p. 2.
- “De eetwarencrisis” [“The food crisis”], Handelsblad, 11 September 1911, p. 1.
- “De Hitte” [“The Heat”], Handelsblad, 2 August 1911, p. 2.
- “De Hitte” [“The Heat”], Handelsblad, 24 July 1911, p. 3.
- “De Hitte” [“The Heat”], Handelsblad, 25 July 1911, p. 2.
- “De Sterfte te Londen” [“Mortality in London”], Handelsblad, 24 August 1911, p. 2.
- “Gevolgen der aanhoudende droogte” [“Effects of the prolonged drought”], Handelsblad, 24 August 1911, p. 4.
- “Grote brand aan de dokken” [“Huge fire at the docks”], Handelsblad, 11 August 1911, p. 1.
- “Hitte en onweer” [“Heat and thunderstorms”], Handelsblad, 31 July 1911, p. 2.
- “Slachtoffers van de Hitte” [“Victims of the Heat”], Gazet van Antwerpen, 31 July 1911, p. 4.
- De Smet D., “Beperkte sterfte door hittegolf” [Limited mortality due to heat wave”], De Standaard, 12 September 2022, p. 9.
- UGent, Quetelet Center, S.O.S. Antwerp Database
Literature
- Brücker, G. (2005), “Vulnerable populations: lessons learnt from the summer 2003 heat waves in Europe”, Eurosurveillance 10, no. (7) (2005): 1-2.
- Deboosere, F., “Wat is een hittegolf?” [“What is a heat wave”], https://www.frankdeboosere.be/vragen/vraag227.php (consulted on 19.09.2022).
- García-Herrera, R., J. Díaz, et al. (2010), “A Review of the European Summer Heat Wave of 2003”, Critical Reviews in Environmental Science and Technology 40, no. (4) (2010): 267-306.
- Kosatsky, T. (2005), “The 2003 European heat waves”, Eurosurveillance 10, no. (7) (2005): 3-4.
- Masuy-Stroobant, G. (2010), “1911: un été exceptionnel en Belgique?” [“1911: an exceptional summer in Belgium”], Annales de démographie historique, no. (120) (2010): 179-197.
- United Nations Regional Information Centre, “Klimaat: worden hittegolven ‘nieuwe normaal’?)” [“Climate: are heat waves becoming the ‘new normal’?”], https://unric.org/nl/klimaat-worden-hittegolven-nieuwe-normaal/ (consulted on 19.09.2022).
- Robine, J.-M., S. L. K. Cheung, et al. (2008), “Death toll exceeded 70,000 in Europe during the summer of 2003”, Comptes Rendus Biologies 331, no. (2) (2008): 171-178.
- Sardon, J.-P. (2007), “The 2003 heat wave”, Eurosurveillance 12, no. (3) (2007): 11-12.
- Sartor, F. (2004), La surmortalité en Belgique au cours de l’été 2003 [Excess mortality in Belgium during the summer of 2003]. IPH/EPI Reports no. 2004 – 009. Brussels, Institut Scientifique de Santé Publique, 2004.
- Vlaamse Milieumaatschappij, “Slachtoffers bij hittegolven” [“Victims of heat waves”], https://www.vlaanderen.be/DataCatalogRecord/bcc21e33-5a2e-30ba-8ad8-872c2fa3660d (consulted on 19.09.2022).
The S.O.S. Antwerp dataset is under construction and is scheduled to be put into use in the course of 2023. Anyone wishing to use the data infrastructure can contact a Quetelet Centre staff member at queteletcenter@ugent.be.
The database came about through a citizen science project. You can follow the progress of the project at www.sosantwerpen.be.
Feel like lending a hand? Then send a message to sosantwerpen@ugent.be.